Documentation Revision Date: 2018-12-28
Data Set Version: 1
Summary
There are six data files, one for each site, in comma-separated (.csv) format in this dataset. Data are not available for the BNZ site at this time.

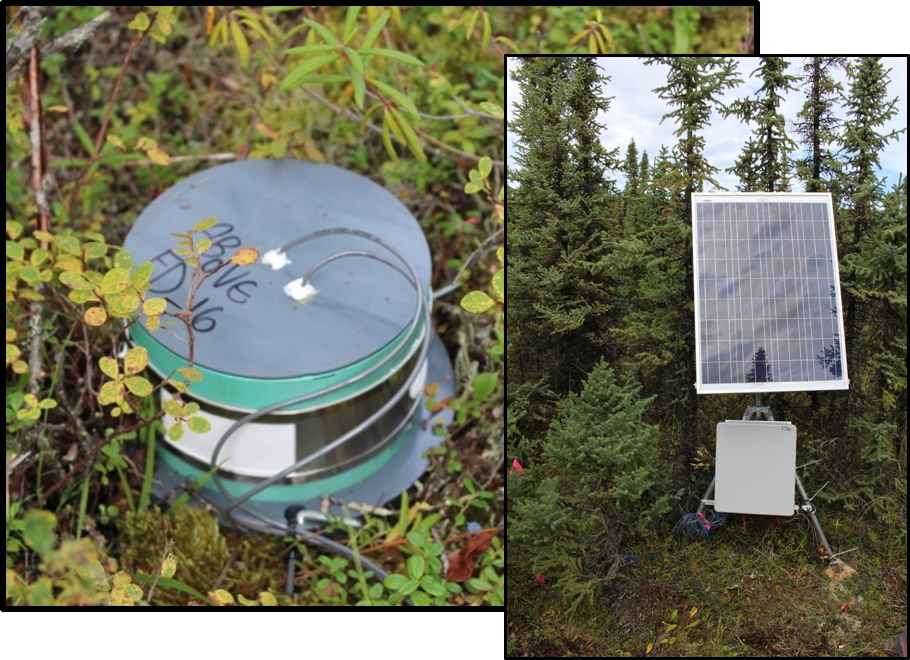
Figure 1. Forced diffusion chambers (FD) were used to continuously measure soil respiration CO2 efflux at the selected study sites. Three FDs (left) and a solar panel power system (right) were installed at each site.
Citation
Minions, C., S. Natali, S. Ludwig, and J. Watts. 2018. ABoVE: Year-round Soil CO2 Efflux in Alaskan Ecosystems. ORNL DAAC, Oak Ridge, Tennessee, USA. https://doi.org/10.3334/ORNLDAAC/1620
Table of Contents
- Data Set Overview
- Data Characteristics
- Application and Derivation
- Quality Assessment
- Data Acquisition, Materials, and Methods
- Data Access
- References
Data Set Overview
This dataset provides soil surface CO2 efflux derived from measurements of soil respiration using forced diffusion (FD) chambers. Measurement systems were established at seven selected sites within diverse ecosystems along a S-N transect from near Fairbanks in interior Alaska to Toolik Lake in northern Alaska. The soil respiration forced diffusion (FD) chambers are fully automated, low-powered systems that measured soil surface CO2 efflux and ambient atmospheric CO2 concentrations using an eosGP CO2 gas analyzer and pumping system. Flux was calculated using the two CO2 values and a chamber-specific precalibrated constant. Three FD chambers were deployed at each site. The data files include the average of the CO2 efflux of the three chambers, averages, and the standard error. Data have been collected since August 2016 and sampling is continuing at active sites. New data will be added as they become available.
Project: Arctic-Boreal Vulnerability Experiment
The Arctic-Boreal Vulnerability Experiment (ABoVE) is a NASA Terrestrial Ecology Program field campaign based in Alaska and western Canada between 2016 and 2021. Research for ABoVE links field-based, process-level studies with geospatial data products derived from airborne and satellite sensors, providing a foundation for improving the analysis and modeling capabilities needed to understand and predict ecosystem responses and societal implications.
Acknowledgements: This research was funded by NASA grant number NNX15AT81A.
Data Characteristics
ABoVE Reference Locations:
Domain: Core ABoVE
Grid cells: Ah01av0Bh7bv5Ch042cv32, Ah01av0Bh6bv4Ch40cv29, Ah01av0Bh6bv5Ch37cv34, Ah01av0Bh8bv3Ch48cv21, Ah01av0Bh6bv5Ch39cv32
Spatial resolution: Point
Temporal coverage: 2016-08-15 to 2018-04-21
Temporal resolution: Hourly and daily
Study Area: (All latitude and longitude given in decimal degrees)
| Site | Westernmost Longitude | Easternmost Longitude | Northernmost Latitude | Southernmost Latitude |
|---|---|---|---|---|
| Alaska | -149.532908 | -146.560019 | 68.557159 | 63.880123 |
Data file information
There are six data files with this dataset in comma-separated (.csv) format. The files provide soil CO2 efflux in units of umol m-2 s-1 from six sites in Alaska (one file per site). Measurement dates vary by site.
The files are named Alaska_site_CO2_flux.csv where “site” is one of the following: EML, HCB, HCU, IMNH, IMNL, or NCU_OLD.
Table 2. Site names and information.
Stations marked with * are still currently active and collecting data. The data for these sites will be updated as new data become available. **BNZ site data is not included with this dataset but will be added as it becomes available.
| Site | Start Date | End Date | Latitude | Longitude |
|---|---|---|---|---|
| Hess Creek, unburned (HCU) * | 2016-08-22 | 2017-12-03 | 65.567389 | -148.925157 |
| Hess Creek, burned (HCB) * | 2016-08-17 | 2017-12-05 | 65.568762 | -148.92344 |
| Nome Creek Unburned – Old (NCU_OLD) | 2016-08-23 | 2017-06-13 | 65.285561 | 146.560019 |
| Eight Mile Lake (EML) * | 2016-08-15 | 2018-04-21 | 63.880123 | -148.325677 |
| Bonanza Creek (BNZ) ** | 2016-08-24 | 2018-01-20 | 64.695999 | -148.325677 |
| I-Minus Low (IMNL) | 2016-08-18 | 2017-06-22 | 68.5593 | -149.51605 |
| I-Minus High (IMNH) | 2016-08-18 | 2017-06-22 | 68.557159 | -149.532908 |
Table 3. Variables in the data files are the same for all files.
Missing values are represented by -9999. The average flux and standard error are reported only if all three FD chamber fluxes are reported. For many observations, only one or two chamber fluxes are reported.
| Column Name | Units/format | Description |
|---|---|---|
| site | There are seven sites named in the files with abbreviations; one file per site. Refer to Table 2 for site names and abbreviations | |
| latitude | Decimal degrees | Latitude of site in decimal degrees |
| longitude | Decimal degrees | Longitude of site in decimal degrees |
| date | YYYY-MM-DD | Date of measurements (YYYY-MM-DD) |
| time | HH:MM | Time of measurement |
| FD#_low_flux | μmol CO2 m-2 s-1 | Soil CO2 flux values calculated for FD chambers. There are three chambers per site (e.g., FD28, FD17, FD29) |
| avg_flux | μmol CO2 m-2 s-1 | Average soil CO2 flux of all three FD chamber values |
| se_flux | μmol CO2 m-2 s-1 | Standard error of the soil CO2 flux |
| upper_ci_flux | μmol CO2 m-2 s-1 | Upper confidence interval. Calculated by the mean + std error. |
| lower_ci_flux | μmol CO2 m-2 s-1 | Lower confidence interval. Calculated by the mean - std error. |
Application and Derivation
Measurements of soil carbon dioxide efflux provide critical information on soil carbon balance. The soil respiration station FD chamber provides a stable field technique for measuring soil CO2 efflux in remote areas such as Alaska. The method currently uses 10× less power than a comparable autochamber, with the potential for further gains. It is also inherently reliable because there are no moving parts.
Quality Assessment
All raw CO2 concentration measurements that were below the instruments limit of detection (LOD) were removed from the data set before fluxes were calculated. A limit of detection for CO2 measured from the FD chambers was also determined and applied to the data set. Any flux values that fell above or below the LOD were eliminated. Uncertainty was quantified by the standard error of the mean for the fluxes measured by the three FD chambers at each site.
Data Acquisition, Materials, and Methods
Site descriptions
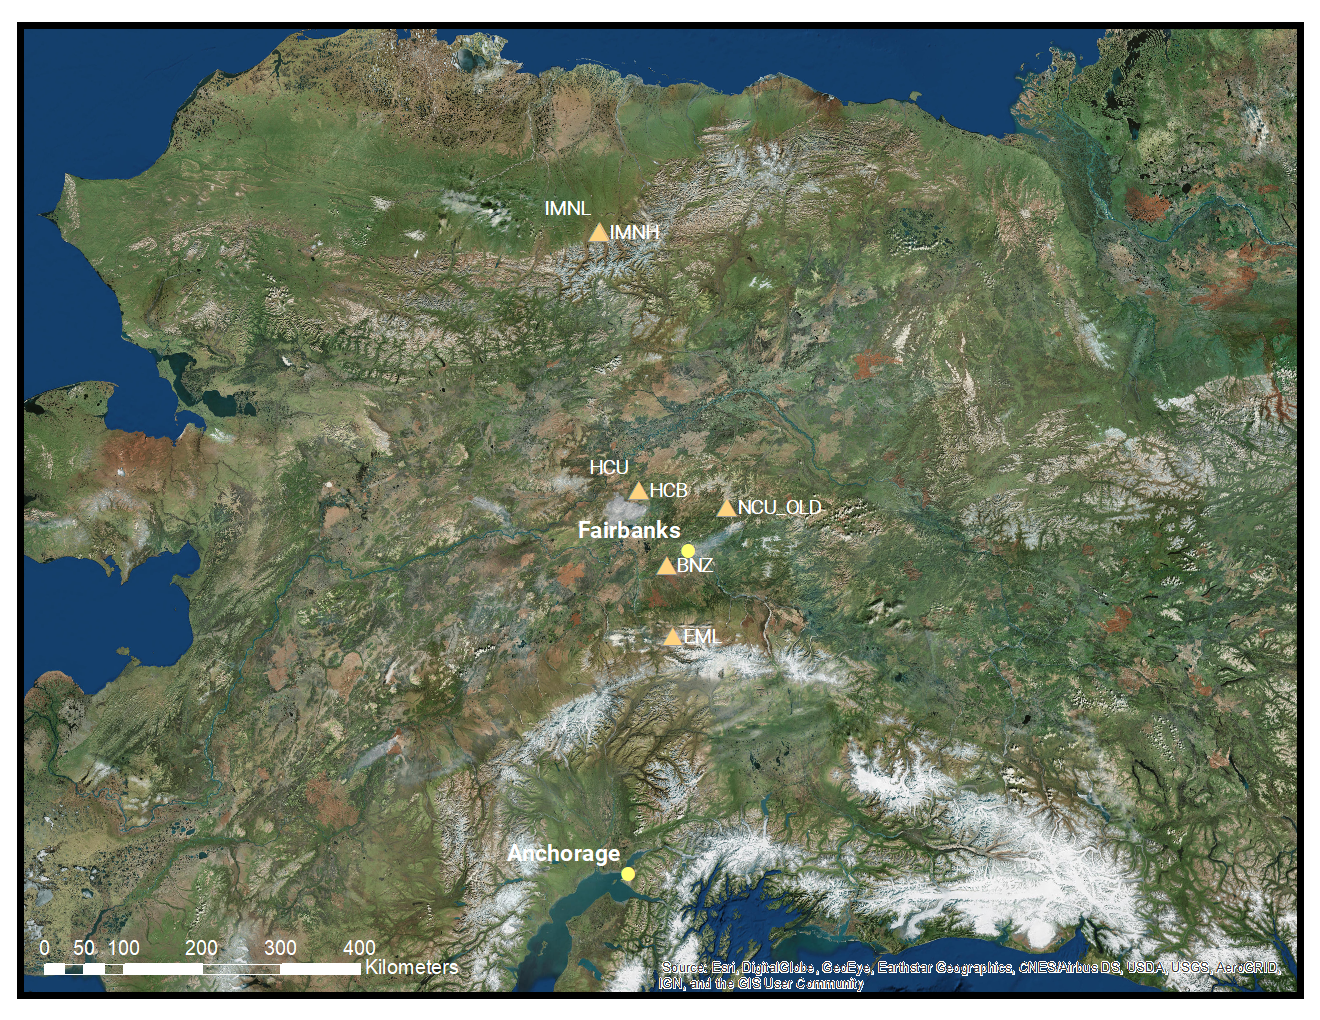
CO2 flux was calculated from measurements recorded by soil respiration stations at seven sites in interior and northern Alaska described below.

Figure 2. Study site locations in Alaska.
Table 4. Study sites.
| Site name | Description |
|---|---|
| Hess Creek Unburned (HCU) | The site is located just off the Dalton Highway between mile 11 and 12, within an unburned boreal black spruce forest. |
| Hess Creek Burned (HCB) | The site is located just off of the Dalton Highway between mile 11 and 12, within a burned boreal black spruce forest (burned in 1995). |
| Nome Creek Unburned – Old (NCU_OLD) | The site is located within the White Mountain Recreation Area, on a south-facing slope characterized by willow/herbaceous scrub vegetation. |
| Eight Mile Lake (EML) | The site is located off of the Stampede Trail in Healy. The area is characterized by moist tundra and sedge/shrub vegetation. |
| Bonanza Creek (BNZ)** | The site is located near the Bonanza Creek LTER Site, within a boreal black spruce stand. ** Data not available at this time. |
| I-Minus Low (IMNL) | The site is located approximately 1 km off the Dalton Highway, a few miles south of Toolik Field Station. The station is in a lowland, wet sedge fen (riparian area). |
| I-Minus High (IMNH) | The site is located approximately 1 km off the Dalton Highway, a few miles south of Toolik Field Station. The station is located on top of a hill and is characterized by tussock tundra. |
CO2 flux calculations
The soil respiration station is a fully automated, low-power system that measures soil surface CO2 flux from three forced diffusion (FD) chambers (Figure 1). The FD chamber is a soil CO2 monitoring instrument functionally similar to a dynamic chamber, but the passive regulation of gas flow means that internal concentration sensors can be switched off between measurements, thereby achieving very low power consumption and high reliability (Risk et al., 2011). The FD housing contains a single high accuracy CO2 sensor, an internal data-logger, two valves, and a small diaphragm pump that operates only for short duration to bring air to the sensor (Kim et al., 2016).
To perform flux measurements, the instrument takes the difference of two CO2 concentrations recorded from each FD chamber: one for atmospheric CO2 and one for soil CO2 using an eosGP (Eosense Inc.) CO2 gas analyzer, and pumping system. The values for CO2 are in ppm. Using these two values, and a chamber-specific, pre-calibrated constant, G, flux can be determined:
Flux = G ( Soil CO2 - Atm CO2 )
The units for flux are in umol m-2 s-1. At the highest measurement frequency, data is collected hourly, and at the lowest frequency once per day. The measurement frequency is reduced during the winter months to conserve power.
Data Access
These data are available through the Oak Ridge National Laboratory (ORNL) Distributed Active Archive Center (DAAC).
ABoVE: Year-round Soil CO2 Efflux in Alaskan Ecosystems
Contact for Data Center Access Information:
- E-mail: uso@daac.ornl.gov
- Telephone: +1 (865) 241-3952
References
Kim, Y., S.J. Park, B.Y. Lee, and D. Risk. 2016. Continuous measurement of soil carbon efflux with Forced Diffusion (FD) chambers in a tundra ecosystem of Alaska. Science of The Total Environment, Volumes 566–567, 1 October, Pages 175-184. https://doi.org/10.1016/j.scitotenv.2016.05.052
Risk, D., Nickerson, N., Creelman, C., McArthur, G., Owens, J., 2011. Forced Diffusion soil flux: A new technique for continuous monitoring of soil gas efflux. Agricultural and Forest Meteorology 151, 1622-1631. https://doi.org/10.1016/j.agrformet.2011.06.020