Documentation Revision Date: 2026-02-19
Dataset Version: 1
Summary
NASA facility instruments operate out of a NASA research center and support multiple science disciplines, field investigations, and NASA science objectives. Facility instruments are supported by managers in the Earth Science Division (ESD) Research and Analysis Program, and/or the Earth Observation System (EOS) Project Science Office. The AVIRIS-5 project operates under the Earth Science Airborne Program of the Jet Propulsion Laboratory. In addition to operating and maintaining the sensor, the AVIRIS-5 project works to ensure that experiment requirements are met for each flight and that users are satisfied with data quality and the level of service provided.
This dataset holds orthocorrected surface reflectance and uncertainty in netCDF format, quicklook images as TIFF images, and processing information in text-based YAML format. Additional L2A data from AVIRIS-5 will be added when available. This dataset will include all L2A files from the AVIRIS-5 facility instrument.
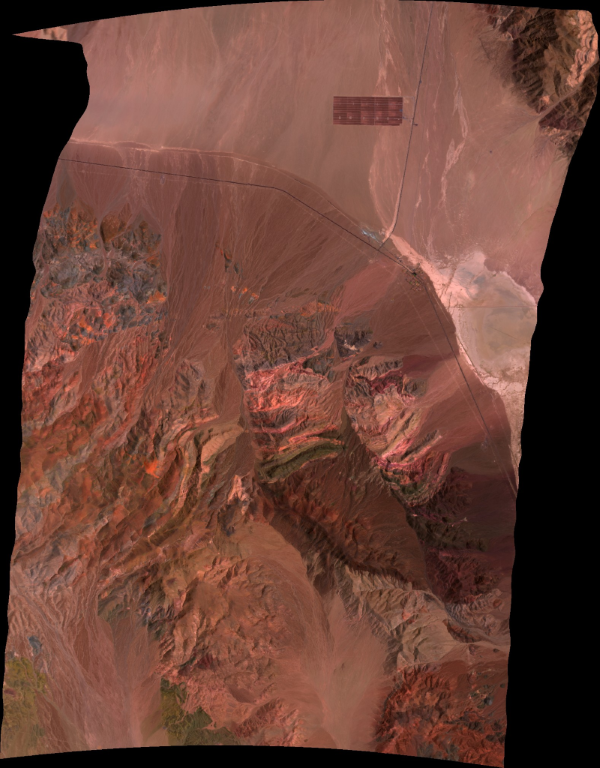
Figure 1. False color image derived from AVIRIS-5 orthocorrected surface reflectance data acquired on 2025-06-12 approximately 36.5 km east of Hawthorne, Nevada (center 38.48 latitude, -118.23 longitude); flight AV520250612t171525.
Citation
Brodrick, P.G., A.M. Chlus, N. Bohn, E. Greenberg, J. Montgomery, J.W. Chapman, M. Eastwood, S.R. Lundeen, R. Eckert, W. Olson-Duvall, D.R. Thompson, and R.O. Green. 2026. AVIRIS-5 L2A Orthocorrected Surface Reflectance, Facility Instrument Collection. ORNL DAAC, Oak Ridge, Tennessee, USA. https://doi.org/10.3334/ORNLDAAC/2484
Table of Contents
- Dataset Overview
- Data Characteristics
- Application and Derivation
- Quality Assessment
- Data Acquisition, Materials, and Methods
- Data Access
- References
Dataset Overview
This dataset contains Level 2A (L2A) surface reflectance images from the Airborne Visible / Infrared Imaging Spectrometer-5 (AVIRIS-5) instrument. This is the NASA Earth Observing System Data and Information System (EOSDIS) facility instrument archive of these data. The NASA AVIRIS-5 is a spectral mapping system that measures reflected radiance at 5-nm intervals in the Visible to Shortwave Infrared (VSWIR) spectral range from 380-2500 nm. The AVIRIS-5 sensor has a 40-degree instantaneous field of view with 1239 pixels, providing altitude dependent ground sampling distances from 12 m to sub meter range. This spectrometer measures radiance from surface and atmosphere and is extremely similar in design to the orbital Earth Surface Mineral Dust Source Investigation (EMIT) spectrometer. Surface hemispherical directional reflectance was derived from calibrated radiance using an optimal estimation algorithm.
For each flight line, two file types are included: orthocorrected surface reflectance (RFL_ORT) and orthocorrected reflectance uncertainty (UNC_ORT) in netCDF format. Both file types include data projected in a UTM coordinate system. In addition, ancillary files for each flight line are provided, including a quick look image in GeoTIFF format and text files in YAML format that document processing algorithms and parameters used during production.
NASA facility instruments operate out of a NASA research center and support multiple science disciplines, field investigations, and NASA science objectives. Facility instruments are supported by managers in the Earth Science Division (ESD) Research and Analysis Program, and/or the Earth Observation System (EOS) Project Science Office. The AVIRIS-5 project operates under the Earth Science Airborne Program of the Jet Propulsion Laboratory. In addition to operating and maintaining the sensor, the AVIRIS-5 project works to ensure that experiment requirements are met for each flight and that users are satisfied with data quality and the level of service provided.
Project: AVIRIS
The Airborne Visible InfraRed Imaging Spectrometer - Classic (AVIRIS-C) and Next Generation (AVIRIS-NG) are two Facility Instruments (FIs) that are part of NASA’s Airborne Science Program (ASP) and the Jet Propulsion Laboratory’s (JPL) Earth Science Airborne Program. The AVIRIS-C is an imaging spectrometer that delivers calibrated images of the upwelling spectral radiance in 224 contiguous spectral channels with wavelengths from 400 to 2500 nanometers (nm). The AVIRIS-NG is the successor to AVIRIS-Classic and provides high signal-to-noise ratio imaging spectroscopy measurements in 425 contiguous spectral channels with wavelengths in the solar reflected spectral range (380-2510 nm). The AVIRIS-NG started operation in 2014 and is expected to replace the AVIRIS-C instrument. Data from AVIRIS-C and AVIRIS-NG have been applied to a wide range of studies in the fields of terrestrial and coastal aquatic plant physiology, atmospheric and aerosol studies, environmental science, snow hydrology, geology, volcanology, oceanography, soil and land management, agriculture, and limnology.
AVIRIS-3 and AVIRIS-5 have been added to this group of image spectrometers. AVIRIS-3 and AVIRIS-5 both feature an optical design in the Dyson family, more similar to the EMIT spectrometer on the ISS. The newer design enables a higher throughput, facilitating substantially wider (more than double) swath width from AVIRIS-NG at a higher SNR. AVIRIS-5 expands on the AVIRIS-3 design by increasing the spectral sampling down from 7.4 nm to 5 nm.
Related Publications
Green, R.O., M.E. Schaepman, P. Mouroulis, S. Geier, L. Shaw, A. Hueini, M. Bernas, I. McKinley, C. Smith, R. Wehbe, M. Eastwood, Q. Vinckier, E. Liggett, S. Zandbergen, D. Thompson, P. Sullivan, C. Sarture, B. Van Gorp, and M. Helmlinger. 2022. Airborne Visible/Infrared Imaging Spectrometer 3 (AVIRIS-3). 2022 IEEE Aerospace Conference (AERO). https://doi.org/10.1109/AERO53065.2022.9843565
Chapman, J.W., D.R. Thompson, M.C. Helmlinger, B.D. Bue, R.O. Green, M.L. Eastwood, S. Geier, W. Olson-Duvall, and S.R. Lundeen. 2019. Spectral and Radiometric Calibration of the Next Generation Airborne Visible Infrared Spectrometer (AVIRIS-NG). Remote Sensing 11:2129. https://doi.org/10.3390/rs11182129
Thompson, D.R., R.O. Green, C. Bradley, P.G. Brodrick, N. Mahowald, E.B. Dor, M. Bennett, M. Bernas, N. Carmon, K.D. Chadwick, R.N. Clark, R.W. Coleman, E. Cox, E. Diaz, M.L. Eastwood, R. Eckert, B.L. Ehlmann, P. Ginoux, M.G. Ageitos, K. Grant, L. Guanter, D.H. Pearlshtien, M. Helmlinger, H. Herzog, T. Hoefen, Y. Huang, A. Keebler, O. Kalashnikova, D. Keymeulen, R. Kokaly, M. Klose, L. Li, S.R. Lundeen, J. Meyer, E. Middleton, R.L. Miller, P. Mouroulis, B. Oaida, V. Obiso, F. Ochoa, W. Olson-Duvall, G.S. Okin, T.H. Painter, C. Pérez García-Pando, R. Pollock, V. Realmuto, L. Shaw, P. Sullivan, G. Swayze, E. Thingvold, A.K. Thorpe, S. Vannan, C. Villarreal, C. Ung, D.W. Wilson, and S. Zandbergen. 2024. On-orbit calibration and performance of the EMIT imaging spectrometer. Remote Sensing of Environment 303:113986. https://doi.org/10.1016/j.rse.2023.113986
Related Datasets
Eckert, R., D.R. Thompson, A.M. Chlus, J.W. Chapman, M. Eastwood, M. Bernas, S. Geier, D. Keymeulen, P. Sullivan, W. Olson-Duvall, E. Greenberg, R.O. Green, and P.G. Brodrick. 2026. AVIRIS-5 L1B Calibrated Radiance, Facility Instrument Collection. ORNL DAAC, Oak Ridge, Tennessee, USA. https://doi.org/10.3334/ORNLDAAC/2483
- The L2A products were derived from these radiance data.
Thorpe, A.K., J. Fahlen, A.M. Chlus, P.G. Brodrick, J.W. Chapman, D.J. Jensen, R.W. Coleman, W. Olson-Duvall, D.R. Thompson, and R.O. Green. 2025. AVIRIS-5 L2B Greenhouse Gas Enhancements, Facility Instrument Collection. ORNL DAAC, Oak Ridge, Tennessee, USA. https://doi.org/10.3334/ORNLDAAC/2485
Data Characteristics
Spatial Resolution: 0.5 to 20 m (altitude dependent)
Temporal Resolution: One-time estimate
Data File Information
This dataset includes surface reflectance and surface reflectance uncertainty in netCDF format, quicklook images as GeoTIFFs, and processing information in text-based YAML format.
The naming convention for the files is <flight prefix>_<id>_<level>_<ver>_<product>.<ext>, where
- <flight prefix> = flight line identifier, AV3YYYYMMDDthhmmss, encoding the date and time by year (YYYY), month (MM), day (DD), hour (hh), minute (mm), and second (ss) of the flight (e.g., AV520230711t225833).
- <id> = scene-id from within a flight line.
- <level> = data level: “L2A_OE” for Level 2A from optimal estimation.
- <ver> = unique eight character identifier of full heritage versioning.
- <product> = Level 2A data product: “RFL_ORT'' for surface reflectance, “UNC_ORT'' for reflectance uncertainty, and “RFL_ORT_QL” for quicklook image.
- <ext> = file extension indicating file type: “nc” for netCDF, "tif” for GeoTIFF, “yaml” for YAML text file.
Example file names for one flight line are:
- AV520250612t171525_001_L2A_OE_f12ff126_RFL_ORT.nc
- AV520250612t171525_001_L2A_OE_f12ff126_RFL_ORT_QL.tif
- AV520250612t171525_001_L2A_OE_f12ff126_UNC_ORT.nc
- AV520250612t171525_001_L2A_OE_f12ff126.yaml
The surface reflectance (RFL) and reflectance uncertainty (UNC_ORT) files hold orthocorrected data projected into the UTM coordinate system using WGS-84 datum (Table 1). Projection information is included with attributes of the transverse_mercator variable in these files. Nodata values are set to -9999.
The quicklook images (*_RFL_ORT_QL.tif) are GeoTIFFs with three bands (RGB) in projected UTM coordinates.
Table 1. Variables in surface reflectance (RFL_ORT) and reflectance uncertainty (UNC_ORT) files.
| Variable | Description | Units |
|---|---|---|
| Both RFL_ORT and UNC_ORT | ||
| easting | UTM easting coordinate for center of grid cell for orthocorrected pixel location | m |
| northing | UTM northing coordinate for center of grid cell for orthocorrected pixel location | m |
| transverse_mercator | Spatial reference information for the UTM coordinate reference system used | - |
| wavelength | Center wavelength for each spectral band (n = 425) | nm |
| fwhm | Full width at half maximum for band (n = 425) | nm |
| RFL_ORT only | ||
| reflectance | Surface hemispherical directional reflectance factor in 425 bands covering wavelengths between 380 nm to 2500 nm in approximately 5-nm intervals, estimated using an optimal estimation based atmospheric correction algorithm | 1 |
| aerosol_optical_thickness | Factor measuring absorption or optical pathlength of measured radiance; level of aerosols in atmosphere | 1 |
| water_vapor | Level of water vapor in the atmosphere between sensor and surface measured in linear units of condensed liquid. | cm |
| UNC_ORT only | ||
| uncertainty | Uncertainty in surface hemispherical directional reflectance given in standard deviation units and estimated using an optimal estimation based atmospheric correction algorithm | 1 |
Application and Derivation
The main objective of the AVIRIS project is to identify, measure, and monitor constituents of the Earth's surface and atmosphere based on molecular absorption and particle scattering signatures. Research with AVIRIS data is predominantly focused on understanding processes related to the global environment and climate change.
The Airborne Visible/Infrared Imaging Spectrometer 5 (AVIRIS-5) is the fourth of the NASA AVIRIS spectrometer series. The core spectrometer of AVIRIS-5 is similar to the imaging spectrometer used by the Earth Surface Mineral Dust Source Investigation (EMIT) that has been deployed on the International Space Station (ISS). AVIRIS-Classic, AVIRIS-Next Generation, and AVIRIS-3 are the three previously developed instruments (Green et al., 1998).
AVIRIS-5 provides state-of-the-art imaging spectroscopy measurements for NASA science and application through the next decade and beyond. It collects data that can be used for characterization of the Earth's surface and atmosphere from geometrically coherent spectroradiometric measurements. This data can be applied to studies in the fields of oceanography, environmental science, snow hydrology, geology, volcanology, soil and land management, atmospheric and aerosol studies, agriculture, and limnology.
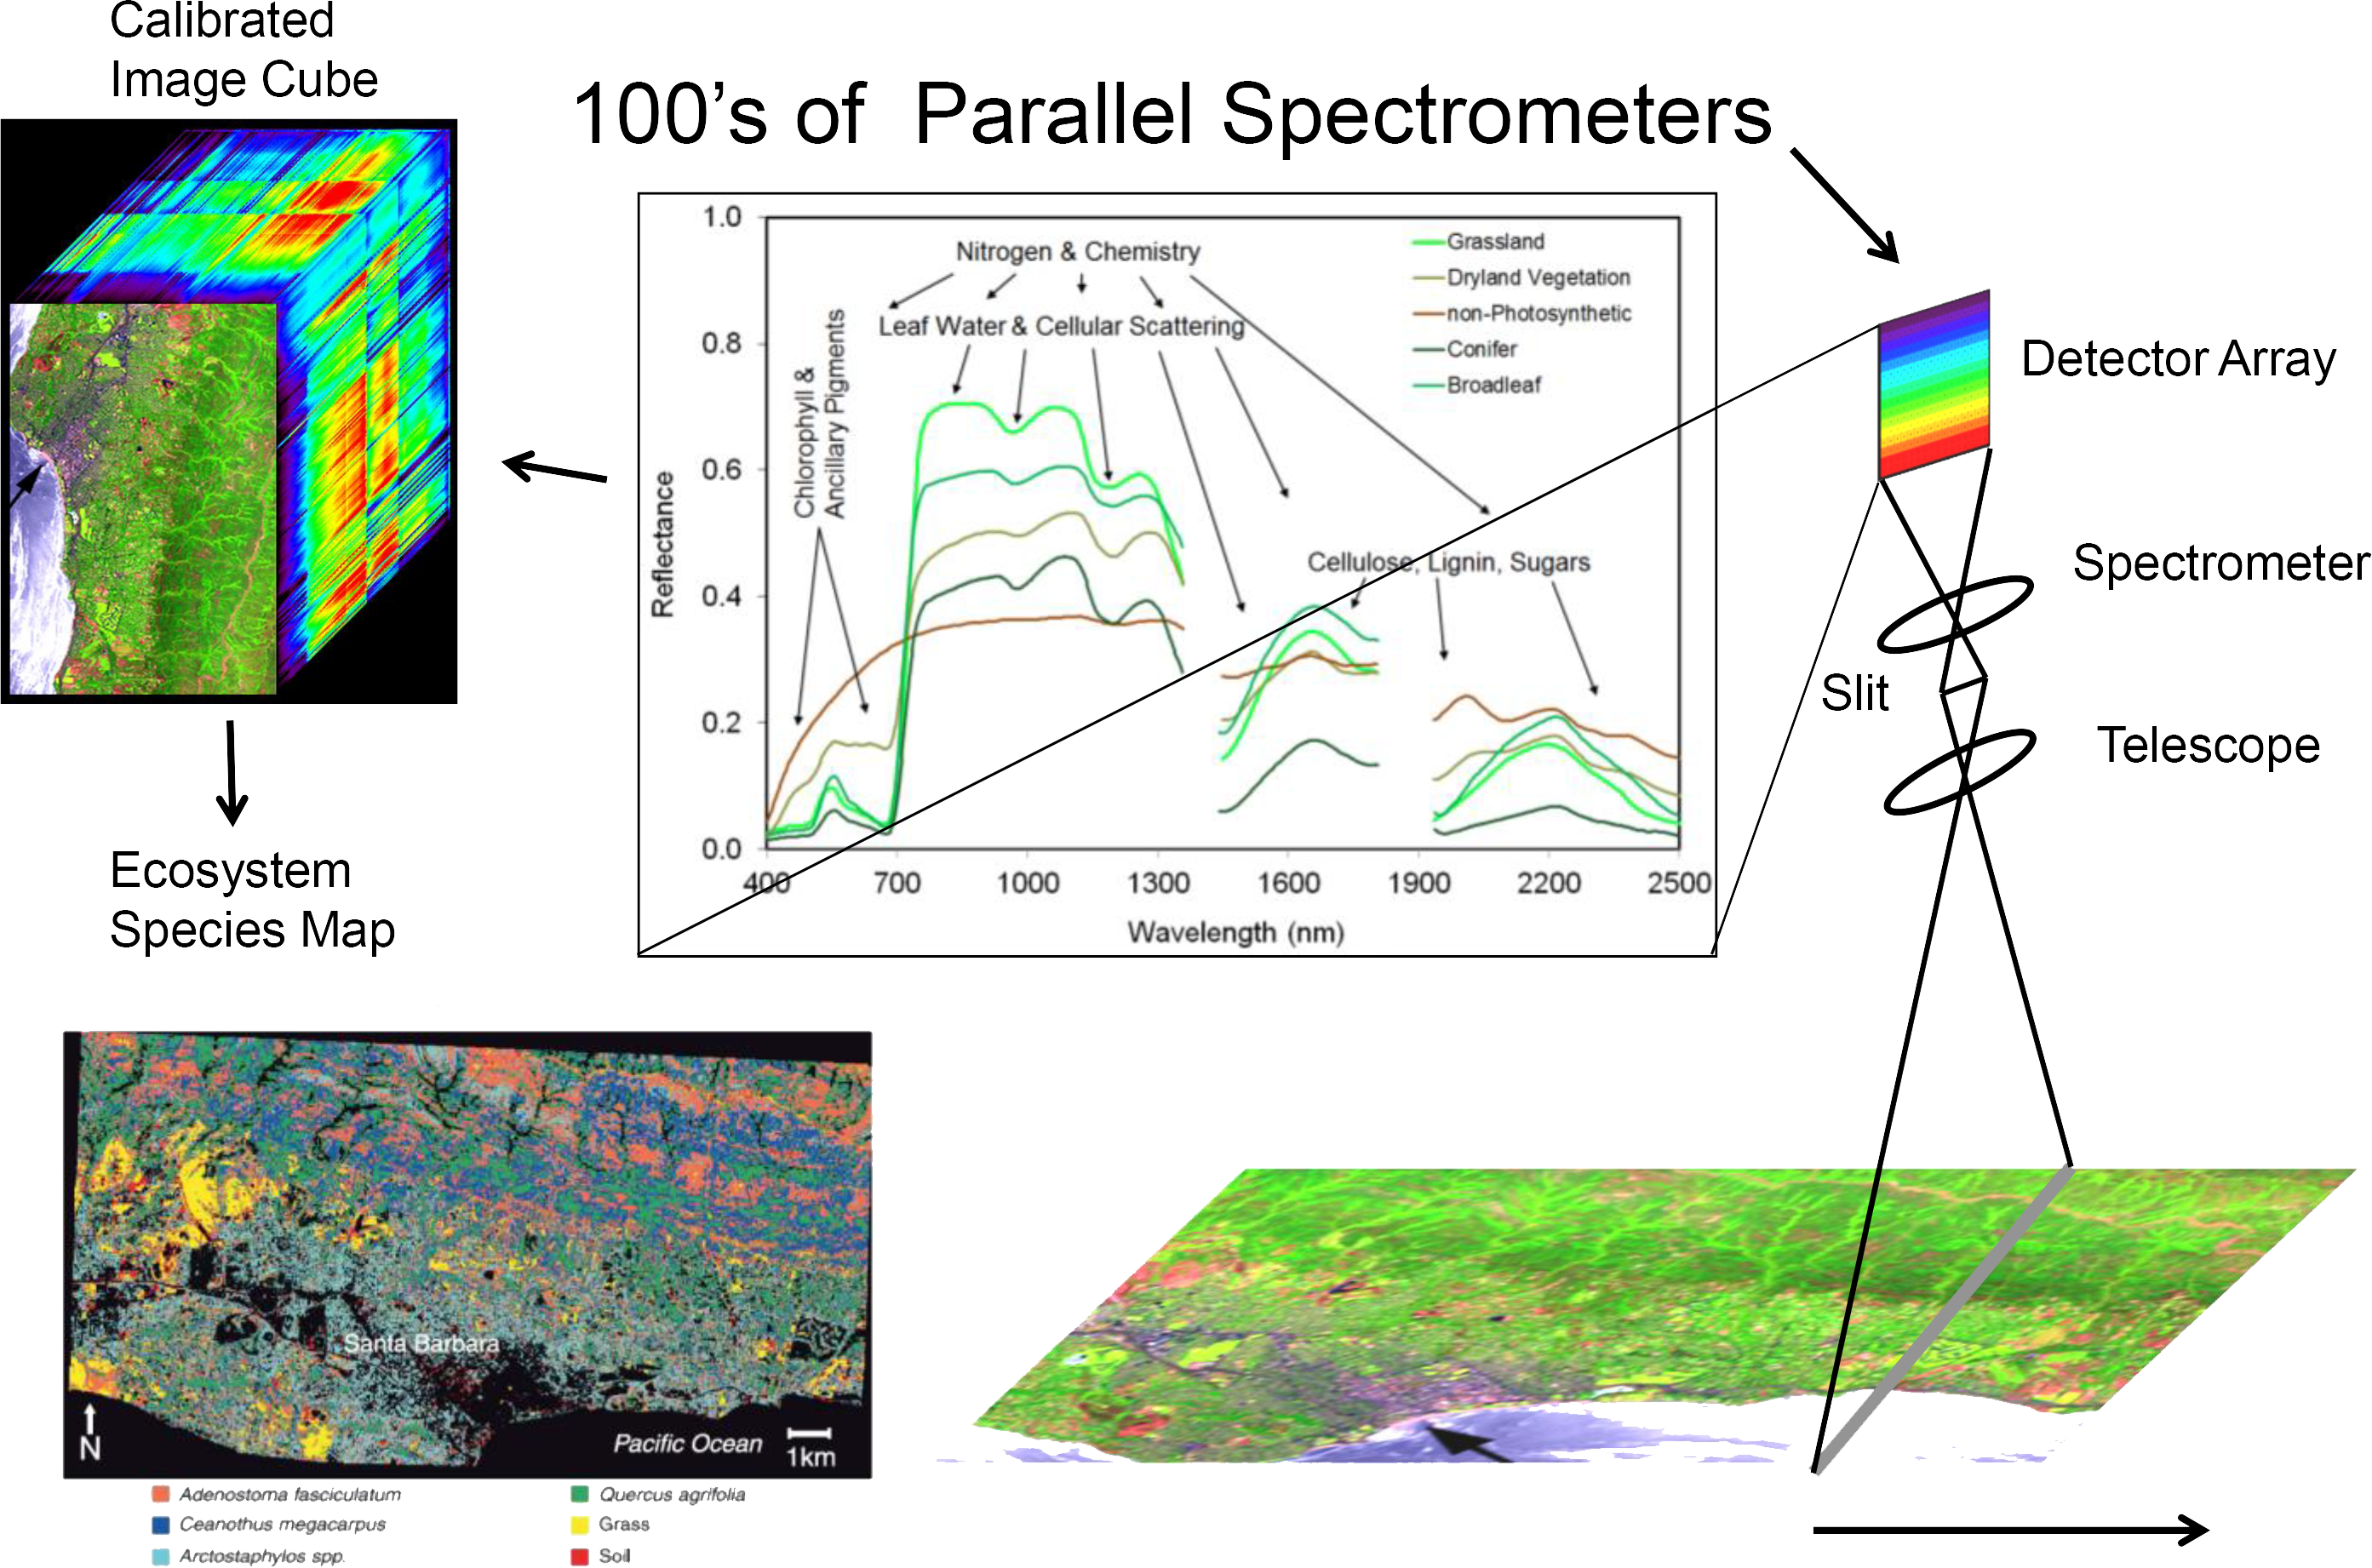
Figure 2. Overview of AVIRIS applications. Source: https://avirisng.jpl.nasa.gov/aviris-ng.html
Quality Assessment
The AVIRIS-5 calibration procedure addresses electronic effects involving radiometric responses of each detector, optical effects involving the spatial and spectral view of each detector, and radiometric calibration. Detector responsiveness is measured at the beginning of each deployment and mid-flight for particularly long deployments. Instrument artifacts in the spectrometer data, such as striping, are removed statistically by minimizing a Markov Random Field model. Likewise, bad pixels are identified and corrected using statistical methods followed by laboratory and field protocols to evaluate effectiveness. Details of calibration methods are available in Chapman et al. (2019).
Data Acquisition, Materials, and Methods
The Airborne Visible-Infrared Imaging Spectrometer 5 (AVIRIS-5) was developed to provide state-of-the-art imaging spectroscopy measurements for NASA science and application through the next decade and beyond (Green et al., 2022). It is deployed on airborne platforms including NASA’s ER-2, B-200, Gulfstream III, Gulfstream V and potentially other aircraft.
AVIRIS-5 is an imaging spectrometer with a two-mirror telescope and Dyson-type spectrometer, which are optically fast (F/1.8), span a wide swath (40-degree field of view over 1239 spatial pixels), and operate over the 380-2500 nm solar-reflected spectrum with 5-nm spectral sampling (425 channels). The spectrometer is identical in design as the EMIT spectrometer now operating in orbit on the International Space Station (ISS).
This Level 2A collection contains surface reflectance data for 425 bands in orthocorrected format. L2A reflectances were derived from the associated L1B radiance data (Eckert et al., 2026). The surface reflectance product (RFL_ORT) includes the hemispherical-directional reflectance factor for every pixel in the scene. Reflectance is estimated from at-sensor radiance (Level 1B) using an optimal estimation (OE) based atmospheric correction procedure, fully described in the EMIT Level 2A ATBD (Thompson et al., 2020).
The OE algorithm produces two maps for each pixel; surface reflectance and reflectance uncertainty. The reflectance uncertainty map (UNC_ORT) was derived from the diagonal elements of the posterior covariance matrix, square-rooted, to provide a spectrum of uncertainty about the reflectance estimate in standard deviations units. Together, these two products define the posterior probability of the surface reflectance given the at-sensor radiance measurement, captured as a multivariate normal distribution. Uncertainty-aware downstream analysis of the reflectance map can leverage both products, using the reflectance uncertainty as error bars over the reflectance estimate.
Pixel locations are provided in projected UTM coordinates. Nodata values are set to -9999.
Data Access
These data are available through the Oak Ridge National Laboratory (ORNL) Distributed Active Archive Center (DAAC).
AVIRIS-5 L2A Orthocorrected Surface Reflectance, Facility Instrument Collection
Contact for Data Center Access Information:
- E-mail: uso@daac.ornl.gov
- Telephone: +1 (865) 241-3952
References
Chapman, J.W., D.R. Thompson, M.C. Helmlinger, B.D. Bue, R.O. Green, M.L. Eastwood, S. Geier, W. Olson-Duvall, and S.R. Lundeen. 2019. Spectral and radiometric calibration of the Next Generation Airborne Visible Infrared Spectrometer (AVIRIS-NG). Remote Sensing 11:2129. https://doi.org/10.3390/rs11182129
Eckert, R., D.R. Thompson, A.M. Chlus, J.W. Chapman, M. Eastwood, M. Bernas, S. Geier, D. Keymeulen, P. Sullivan, W. Olson-Duvall, E. Greenberg, R.O. Green, and P.G. Brodrick. 2026. AVIRIS-5 L1B Calibrated Radiance, Facility Instrument Collection. ORNL DAAC, Oak Ridge, Tennessee, USA. https://doi.org/10.3334/ORNLDAAC/2483
Green, R.O., M.E. Schaepman, P. Mouroulis, S. Geier, L. Shaw, A. Hueini, M. Bernas, I. McKinley, C. Smith, R. Wehbe, M. Eastwood, Q. Vinckier, E. Liggett, S. Zandbergen, D. Thompson, P. Sullivan, C. Sarture, B. Van Gorp, and M. Helmlinger. 2022. Airborne Visible/Infrared Imaging Spectrometer 3 (AVIRIS-3). 2022 IEEE Aerospace Conference (AERO). https://doi.org/10.1109/AERO53065.2022.9843565
Green, R.O., M.L. Eastwood, C.M. Sarture, T. G. Chrien, M. Aronsson, B.J. Chippendale, J.A. Faust, B.E. Pavri, C. J. Chovit, M. Solis, M.R. Olah, and O. Williams. 1998. Imaging spectroscopy and the Airborne Visible/Infrared Imaging Spectrometer (AVIRIS). Remote Sensing of Environment 65:227- 248. https://doi.org/10.1016/S0034-4257(98)00064-9
Thompson, D.R, P.G. Brodrick, R.O. Green, O. Kalashnikova, S. Lundeen, G. Okin, W. Olson-Duvall, and T. Painter. 2020. EMIT L2A Algorithm: Surface Reflectance and Scene Content Masks: Theoretical Basis. Version 1.0. Jet Propulsion Laboratory, California Institute of Technology; Pasadena, California. https://earth.jpl.nasa.gov/emit/internal_resources/281
Thompson, D.R., R.O. Green, C. Bradley, P.G. Brodrick, N. Mahowald, E.B. Dor, M. Bennett, M. Bernas, N. Carmon, K.D. Chadwick, R.N. Clark, R.W. Coleman, E. Cox, E. Diaz, M.L. Eastwood, R. Eckert, B.L. Ehlmann, P. Ginoux, M.G. Ageitos, K. Grant, L. Guanter, D.H. Pearlshtien, M. Helmlinger, H. Herzog, T. Hoefen, Y. Huang, A. Keebler, O. Kalashnikova, D. Keymeulen, R. Kokaly, M. Klose, L. Li, S.R. Lundeen, J. Meyer, E. Middleton, R.L. Miller, P. Mouroulis, B. Oaida, V. Obiso, F. Ochoa, W. Olson-Duvall, G.S. Okin, T.H. Painter, C. Pérez García-Pando, R. Pollock, V. Realmuto, L. Shaw, P. Sullivan, G. Swayze, E. Thingvold, A.K. Thorpe, S. Vannan, C. Villarreal, C. Ung, D.W. Wilson, and S. Zandbergen. 2024. On-orbit calibration and performance of the EMIT imaging spectrometer. Remote Sensing of Environment 303:113986. https://doi.org/10.1016/j.rse.2023.113986
Thorpe, A.K., J. Fahlen, A.M. Chlus, P.G. Brodrick, J.W. Chapman, D.J. Jensen, R.W. Coleman, W. Olson-Duvall, D.R. Thompson, and R.O. Green. 2025. AVIRIS-5 L2B Greenhouse Gas Enhancements, Facility Instrument Collection. ORNL DAAC, Oak Ridge, Tennessee, USA. https://doi.org/10.3334/ORNLDAAC/2485