Documentation Revision Date: 2026-01-22
Dataset Version: 1
Summary
This dataset holds 42 data files in cloud-optimized GeoTIFF (.tif) format.

Figure 1. GEDI derived vegetation metrics for a portion of the Greater Kruger National Park region in South Africa in 2022: Fractional canopy cover (left), Relative height 98th percentile (right, units = m). Area depicted is southwest of Bushbuckridge (approximate center: -24.9013 lat, 30.9881 lon).
Citation
Filippelli, S.K., J. Vogeler, and D. Bunn. 2025. Greater Kruger National Park, GEDI Canopy Metrics, 2007-2024. ORNL DAAC, Oak Ridge, Tennessee, USA. https://doi.org/10.3334/ORNLDAAC/2401
Table of Contents
- Dataset Overview
- Data Characteristics
- Application and Derivation
- Quality Assessment
- Data Acquisition, Materials, and Methods
- Data Access
- References
- Dataset Revisions
Dataset Overview
This dataset contains vegetation canopy metrics for the Greater Kruger National Park region of South Africa for 2007-2010 and 2015-2024. Metrics include relative height 98th percentile (RH98), fractional canopy cover, and foliage height diversity. They were derived by modeling a sample of Global Ecosystem Dynamics Investigation (GEDI) Level 2A Elevation and Height Metrics and Level 2B Canopy Cover and Vertical Profile Metrics at the 25-m footprint level with wall-to-wall spatial datasets including Landsat, PALSAR, topography derived from NASADEM, and soils data from iSDAsoil. Maps for 2023 and 2024 were created by applying the model trained from 2007-2022 data to PALSAR and Landsat data for 2023 and 2024. The data are suitable for analyzing change in woody canopy structure within the savanna ecosystems of this region.
Project: Biodiversity
The ORNL DAAC archives Biological Diversity datasets from research that contribute to the understanding of the complexity, structure, function, and interactions within and among species, ecosystems, and genetic variations, and how and why they are changing. These datasets help explore how biodiversity contributes to ecosystem health, stability, and services, as well as threats due to human activities and environmental changes.
Related Publication
Filippelli, S.K., J.C. Vogeler, F. Mauro, C. Coetsee, P.A. Fekety, M. McHale, and D. Bunn. 2025. Tracking savanna vegetation structure in South Africa by extension of GEDI canopy metrics with Landsat, Sentinel-2, and PALSAR. In review. Preprint: https://doi.org/10.1101/2025.07.16.664478
Acknowledgement
This research was funded by the NASA Biological Diversity and Ecological Conservation program (grant 80NSSC21K1716).
Data Characteristics
Spatial overage: Greater Kruger National Park region of South Africa
Spatial Resolution: 30 m
Temporal Coverage: 2007-2010 and 2015-2024
Temporal Resolution: Annual
Site Boundaries: Latitude and longitude are given in decimal degrees.
| Site | Westernmost Longitude | Easternmost Longitude | Northernmost Latitude | Southernmost Latitude |
|---|---|---|---|---|
| Great Kruger National Park region, South Africa | 29.7380 | 32.0531 | -22.2749 | -26.1412 |
Data File Information
There are 42 data files in cloud-optimized GeoTIFF (.tif) format. There are three groups of files: 14 files for total fractional canopy cover, 14 files for foliage height diversity index, and 14 files for relative height 98th percentile.
File names and data descriptions
For all file groups, YYYY is year from 2007-2010 and 2015-2024.
- Canopy_Metrics_GreaterKNP__cover_YYYY.tif – Total fractional canopy cover from 0 to 1.
This metric's definition corresponds to the "cover" metric from the GEDI Level 2B Canopy Cover and Vertical Profile Metrics product (Dubayah et al., 2021) as described in LPDAAC (2019): “Total canopy cover, defined as the percent of the ground covered by the vertical projection of canopy material.” Details are given in the Algorithm Theoretical Basis Document (Tang and Armston, 2019). - Canopy_Metrics_GreaterKNP_fhd_YYYY.tif – Foliage height diversity index.
This metric's definition corresponds to the “fhd_normal” metric from the GEDI Level 2B Canopy Cover and Vertical Profile Metrics product (Dubayah et al., 2021) as described in LPDAAC (2019): “Foliage height diversity index calculated by vertical foliage profile normalized by total plant area index.” Details are given in the Algorithm Theoretical Basis Document (Tang and Armston, 2019). - Canopy_Metrics_GreaterKNP_rh98_YYYY.tif – Relative height 98th percentile from 0 to 40 m.
This metric's definition corresponds to the relative height metric at the 98th percentile from the GEDI Level 2A Level 2A Elevation and Height Metrics product (Dubayah et al., 2021) and is described in the Algorithm Theoretical Basis Document (Hofton and Blair, 2019).
GeoTIFF characteristics
- Coordinate system: Projected coordinates in UTM zone 36S, EPSG 32736, units = meters.
- Spatial resolution: 30 m
- Dimensions: 7624 columns x 14,167 rows
- Pixel values: fractional canopy cover, foliage height diveristy, or RH98 values as described above.
- Data type: Float32
- Nodata value: -9999
Application and Derivation
The data are suitable for analyzing the spatial pattern and change in time of woody canopy structure within the savanna ecosystems of the region.
Quality Assessment
The accuracy of the random forest model for each canopy metric was assessed by its root mean square error, coefficient of determination, and mean of residuals (bias) using out-of-bag predictions. The accuracy of GEDI’s RH98 values with respect to airborne lidar were assessed for the region by Li et al. (2023).
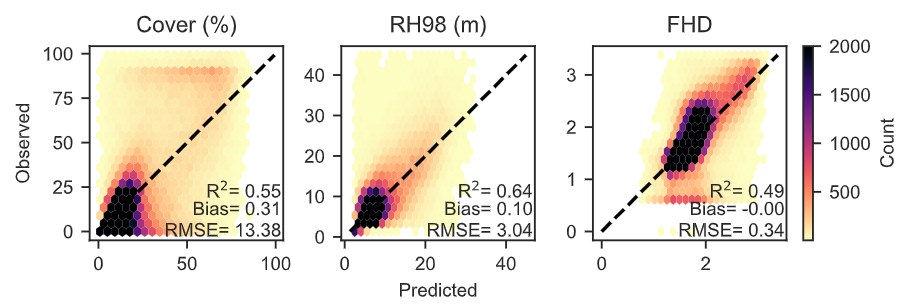
Figure 2. Random forest out-of-bag accuracy for fractional canopy cover (Cover), relative height 98th percentile (RH98), and foliage height diversity (FHD).
Maps for 2023 and 2024 were created by applying the model trained from 2007-2022 data to PALSAR and Landsat data for 2023 and 2024. Uncertainty was not assessed for the 2023 and 2024 maps.
Data Acquisition, Materials, and Methods
The Global Ecosystem Dynamics Investigation (GEDI) canopy metrics of relative height 98th percentile (RH98), fractional canopy cover, and foliage height diversity were extended wall-to-wall at a 30-m resolution for the Great Kruger National Park region of South Africa for 2007-2010 and 2015-2022. These data were created by modeling a sample of the GEDI Level 2B Canopy Cover and Vertical Profile Metrics at the 25-m footprint level (Dubyah et al., 2021) with spatial datasets including Landsat (EROS 2020a; EROS, 2020b; EROS, 2020c), PALSAR (v. 2.1.2 annual backscatter mosaics for 2007-2010 and 2015-2022; Shimada et al., 2014), topography derived from NASADEM (NASA JPL, 2020) and estimated soils data from iSDAsoil (isda, 2023).
Maps for 2023 and 2024 were created by applying the model trained from 2007-2022 data to PALSAR and Landsat data for 2023 and 2024.
Information on the fractional canopy cover, foliage height diversity index, and RH98 metrics is available from GEDI L2B Dictionary (LPDAAC, 2019) and the GEDI Algorithm Theoretical Basis Documents (Tang and Armston, 2019).
Data Access
These data are available through the Oak Ridge National Laboratory (ORNL) Distributed Active Archive Center (DAAC).
Greater Kruger National Park, GEDI Canopy Metrics, 2007-2024
Contact for Data Center Access Information:
- E-mail: uso@daac.ornl.gov
- Telephone: +1 (865) 241-3952
References
Dubayah, R., M. Hofton, J. Blair, J. Armston, H. Tang, and S.Luthcke. 2021. GEDI L2A Elevation and Height Metrics Data Global Footprint Level V002. NASA Land Processes Distributed Active Archive Center. https://doi.org/10.5067/GEDI/GEDI02_A.002
Dubayah, R., H. Tang, J. Armston, S. Luthcke, M. Hofton, J. Blair. 2021. GEDI L2B Canopy Cover and Vertical Profile Metrics Data Global Footprint Level V002. NASA EOSDIS Land Processes Distributed Active Archive Center. https://doi.org/10.5067/GEDI/GEDI02_B.002
EROS. 2020a. Landsat 8-9 Operational Land Imager / Thermal Infrared Sensor Level-2, Collection 2. U.S. Geological Survey. Earth Resources Observation and Science (EROS) Center; Sioux Falls, South Dakota. https://doi.org/10.5066/P9OGBGM6.
EROS. 2020b. Landsat 7 Enhanced Thematic Mapper Plus Level-2, Collection 2. U.S. Geological Survey. Earth Resources Observation and Science (EROS) Center; Sioux Falls, South Dakota. https://doi.org/10.5066/P9C7I13B.
EROS. 2020c. Landsat 4-5 Thematic Mapper Level-2, Collection 2. U.S. Geological Survey. Earth Resources Observation and Science (EROS) Center; Sioux Falls, South Dakota. https://doi.org/10.5066/P9IAXOVV.
Filippelli, S.K., J.C. Vogeler, F. Mauro, C. Coetsee, P.A. Fekety, M. McHale, and D. Bunn. 2025. Tracking savanna vegetation structure in South Africa by extension of GEDI canopy metrics with Landsat, Sentinel-2, and PALSAR. In review. Preprint: https://doi.org/10.1101/2025.07.16.664478
Hofton, M. and J.B. Blair. 2019. Algorithm Theoretical Basis Document (ATBD) for GEDI Transmit and Receive Waveform Processing for L1 and L2 Products. Goddard Space Flight Center, Greenbelt, Maryland. https://lpdaac.usgs.gov/documents/581/GEDI_WF_ATBD_v1.0.pdf
isDA. 2023. African open soil data. https://www.isda-africa.com/isdasoil/open-soil-data/, https://doi.org/10.17605/OSF.IO/A69R5
Li, X., K. Wessells, J. Armston, S. Hancock, R. Mathieu, R. Main, L. Naidoo, B. Erasmus, and R. Scholes. 2023. First validation of GEDI canopy heights in African savannas. Remote Sensing of Environment 285:113402. https://doi.org/10.1016/j.rse.2022.113402
LPDAAC. 2019. GEDI L2B Product Data Dictionary. NASA Goodard Space Flight Center; Greenbelt, Maryland. https://lpdaac.usgs.gov/documents/588/GEDI_FCCVPM_ATBD_v1.0.pdf
NASA JPL. 2020. NASADEM Merged DEM Global 1 arc second V001. NASA EOSDIS Land Processes Distributed Active Archive Center. https://doi.org/10.5067/MEaSUREs/NASADEM/NASADEM_HGT.001
Shimada, M., T. Itoh, T. Motooka, M. Watanabe, S. Tomohiro, R. Thapa, and R. Lucas. 2014. New global forest/non-forest maps from ALOS PALSAR Data (2007-2010). Remote Sensing of Environment 155:13-31. https://doi.org/10.1016/j.rse.2014.04.014
Tang, H. and J. Armston. 2019. Algorithm Theoretical Basis Document (ATBD) for GEDI L2B Footprint Canopy Cover and Vertical Profile Metrics. Version 1.0. NASA Goodard Space Flight Center; Greenbelt, Maryland. https://lpdaac.usgs.gov/documents/588/GEDI_FCCVPM_ATBD_v1.0.pdf
Dataset Revisions
| Version | Release Date | Revision Notes |
|---|---|---|
| 1 | 2026-01-22 | Canopy metric maps for 2023 and 2024 were appended to this dataset. Previously published files were not changed. |
| 1 | 2025-09-15 | First publication |