Documentation Revision Date: 2026-03-20
Dataset Version: 1
Summary
This dataset holds orthocorrected surface reflectance and uncertainty in NetCDF format, quicklook images as TIFF images, and processing information in text-based YAML format.
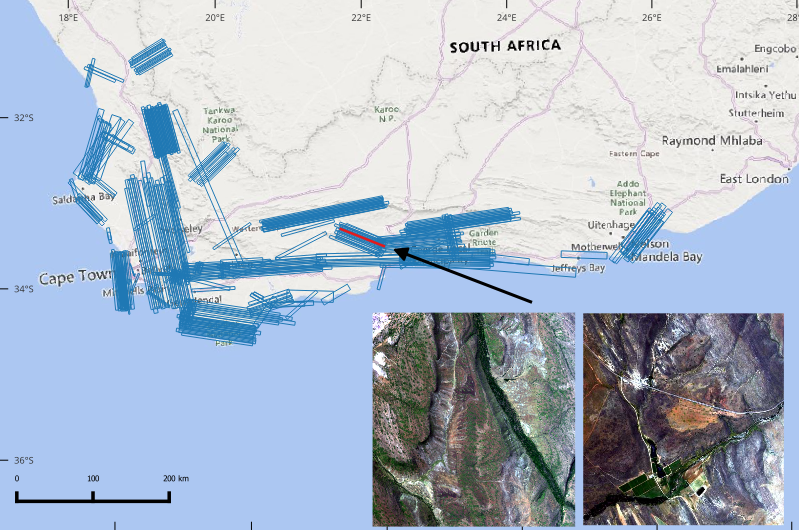
Figure 1. Imagery footprints for PRISM data collected in South Africa for the BioSCape project in October-November 2023 shown as blue rectangles. Insets display quicklooks for two scenes (4 and 20) along the flight line prm20231114t083700 (highlighted as red rectangle) acquired on 14 November 2023 northwest of the city of George, Western Cape Province. Background map: Bing Maps, copyright Microsoft and its suppliers.
Citation
Greenberg, E., P.G. Brodrick, D.R. Thompson, A.M. Chlus, N. Bohn, J. Montgomery, J.W. Chapman, B.A. Wilder, M. Eastwood, S.R. Lundeen, R. Eckert, W. Olson-Duvall, R.F. Kokaly, and R.O. Green. 2026. BioSCape: PRISM L2A Orthocorrected Surface Reflectance. ORNL DAAC, Oak Ridge, Tennessee, USA. https://doi.org/10.3334/ORNLDAAC/2494
Table of Contents
- Dataset Overview
- Data Characteristics
- Application and Derivation
- Quality Assessment
- Data Acquisition, Materials, and Methods
- Data Access
- References
Dataset Overview
This dataset holds Level 2A (L2A) orthocorrected, scaled surface reflectance data collected by the Portable Remote Imaging SpectroMeter (PRISM) instrument. The data were acquired in October-November 2023 for the Biodiversity Survey of the Cape (BioSCape), an international collaboration between National Aeronautics and Space Administration (NASA) and the South African National Space Agency (SANSA) to study biodiversity in South Africa’s Greater Cape Floristic Region (GCFR).
PRISM is a compact image spectrometer that acquires data in the near ultraviolet (UV) to near infrared (IR) spectral bands between 350 and 1050 nanometers with 3.5 nm spectral resolution. PRISM also has a two-channel spot radiometer at short-wave infrared (SWIR) band (1240 nm and 1640 nm) in order to provide accurate atmospheric correction of the ocean color measurements. PRISM’s capabilities make it well suited for studies of aquatic and coastal ecosystems. It was deployed on a NASA Gulfstream III aircraft.
Project: Biodiversity Survey of the Cape (BioSCape)
The Biodiversity Survey of the Cape (BioSCape) is an international collaboration between National Aeronautics and Space Administration (NASA) and the South African National Space Agency (SANSA) to study biodiversity in South Africa’s Greater Cape Floristic Region (GCFR). The GCRF was selected due to two exceptional hotspots of both terrestrial and aquatic biodiversity. The GCRF is listed among the World’s 200 Significant Ecoregions. BioSCape is an integrated field and airborne campaign occurring in 2023. The campaign collected UV/visible to short wavelength infrared (UVSWIR) and thermal imaging spectroscopy and laser altimetry LiDAR data over terrestrial and aquatic targets using four airborne instruments: Airborne Visible InfraRed Imaging Spectrometer - Next Generation (AVIRIS-NG), Portable Remote Imaging SpectroMeter (PRISM), Land, Vegetation, and Ice Sensor (LVIS), and Hyperspectral Thermal Emission Spectrometer (HyTES). The airborne data set is unique in its size and scope and unprecedented in its instrument combination and level of detail. These airborne data was accompanied by a range of biodiversity-related field observations. BioSCape’s primary objective is to understand the structure, function, and composition of the region’s ecosystems, and to learn about how and why they are changing in time and space.
Related Publications
Cardoso, A.W. and The BioSCape Consortium. 2025. BioSCape combines local knowledge and remote-sensing technology for inclusive biodiversity science. Nature Reviews Biodiversity 1:2-4. https://doi.org/10.1038/s44358-024-00007-8
Cardoso, A., E. Hestir, J. Slingsby, C. Forbes, G. Moncrieff, W. Turner, A. Skowno, J. Nesslage, P. Brodrick, K. Gaddis, and A. Wilson. 2025. The biodiversity survey of the Cape (BioSCape), integrating remote sensing with biodiversity science. npj Biodiversity 4:2. https://doi.org/10.1038/s44185-024-00071-5
Related Datasets
Thompson, D.R., R. Eckert, M. Bernas, P.G. Brodrick, A.M. Chlus, J.W. Chapman, M. Eastwood, H. Bender, S. Geier, E. Greenberg, D. Keymeulen, E. Liggett, W. Olson-Duvall, L.M. Rios, E.D. Brunner, D.J. Jensen, S. Zandbergen, Z. Small, L.A. Shaw, P. Sullivan, Q.P. Vinckier, W. Turner, J.Y. Wang, and R.O. Green. 2026. BioSCape: PRISM L1B Calibrated Radiance. ORNL DAAC, Oak Ridge, Tennessee, USA. https://doi.org/10.3334/ORNLDAAC/2493
- The L2A products were derived from these L1B data.
Other field and airborne datasets for BioSCape are available through the BioSCape project page.
Acknowledgement
The BioSCape Project is a multi-agency, NASA-led research project that integrates airborne imaging spectroscopy (AVIRIS NG) and lidar (LVIS) with a suite of surface measures of biodiversity. BioSCape was supported by NASA grant 80NSSC21K0086, the South African government (NRF/SAEON), and the United Nations Educational, Scientific and Cultural Organization (UNESCO). The PRISM instrument is maintained, operated, and the data processing is conducted by the Jet Propulsion Laboratory, California Institute of Technology, in Pasadena, California.
Data Characteristics
Spatial Coverage: Greater Cape Floristic Region of South Africa
Spatial Resolution: approximately 5 m
Temporal Coverage: 2023-10-17 to 2023-11-26
Temporal Resolution: Daily, weather permitting, during deployment
Study Areas: All latitudes and longitudes given in decimal degrees.
| Site | Westernmost Longitude | Easternmost Longitude | Northernmost Latitude | Southernmost Latitude |
|---|---|---|---|---|
| Southern Cape of South Africa |
17.8273 |
26.1288 | -31.2637 | -34.9152 |
Data File Information
This dataset includes surface reflectance and surface reflectance uncertainty in NetCDF format, quicklook images as GeoTIFFs, and processing information in text-based YAML format.
The naming convention for the files is <flight prefix>_<id>_<level>_<ver>_<product>.<ext>, where
- <flight prefix> = flight line identifier, prmYYYYMMDDthhmmss, encoding the date and time by year (YYYY), month (MM), day (DD), hour (hh), minute (mm), and second (ss) of the flight (e.g., prm20231114t083700).
- <id> = scene-id from within a flight line.
- <level> = data level: “L2A_OE” for Level 2A from optimal estimation.
- <ver> = unique eight-character identifier of full heritage versioning.
- <product> = Level 2A data product: “RFL_ORT'' for surface reflectance, “UNC_ORT'' for reflectance uncertainty, and “RFL_ORT_QL” for quicklook image.
- <ext> = file extension indicating file type: “nc” for NetCDF, "tif” for GeoTIFF, “yaml” for YAML text file.
Example file names for one flight line are:
- prm20231114t083700_022_L2A_OE_3a030e80_RFL_ORT.nc
- prm20231114t083700_022_L2A_OE_3a030e80_RFL_ORT_QL.tif
- prm20231114t083700_022_L2A_OE_3a030e80_UNC_ORT.nc
- prm20231114t083700_022_L2A_OE_3a030e80.yaml
The surface reflectance (RFL) and reflectance uncertainty (UNC_ORT) files hold orthocorrected data projected into the UTM coordinate system using WGS-84 datum (Table 1). Projection information is included with attributes of the transverse_mercator variable in these files. Nodata values are set to -9999.
The quicklook images (*_RFL_ORT_QL.tif) are GeoTIFFs with three bands (RGB) in projected UTM coordinates.
Table 1. Variables in surface reflectance (RFL_ORT) and reflectance uncertainty (UNC_ORT) files.
| Variable | Description | Units |
|---|---|---|
| Both RFL_ORT and UNC_ORT | ||
| easting | UTM easting coordinate for center of grid cell for orthocorrected pixel location | m |
| northing | UTM northing coordinate for center of grid cell for orthocorrected pixel location | m |
| transverse_mercator | Spatial reference information for the UTM coordinate reference system used | - |
| wavelength | Center wavelength for each spectral band (n = 246) | nm |
| fwhm | Full width at half maximum for band (n = 246) | nm |
| RFL_ORT only | ||
| reflectance | Surface hemispherical directional reflectance factor in 246 bands covering wavelengths between 350 and 1050 nanometers with 3.5 nm intervals, estimated using an optimal estimation based atmospheric correction algorithm | 1 |
| aerosol_optical_thickness | Factor measuring absorption or optical pathlength of measured radiance; level of aerosols in atmosphere | 1 |
| water_vapor | Level of water vapor in the atmosphere between sensor and surface measured in linear units of condensed liquid. | cm |
| surface_classification | Category for surface: 0=land, 1=water | - |
| sky_glint | Factor for reflectance correction: sky glint | 1 |
| sky_glint_uncertainty | Sky glint magnitude scaling uncertainty | 1 |
| sun_glint | Factor for reflectance correction: sun glint | 1 |
| sun_glint_uncertainty | Sun glint magnitude scaling uncertainty | 1 |
| UNC_ORT only | ||
| uncertainty | Uncertainty in surface hemispherical directional reflectance given in standard deviation units and estimated using an optimal estimation based atmospheric correction algorithm | 1 |
Application and Derivation
NASA’s BioSCape project is an integrated field and airborne campaign occurring in the hyperdiverse Cape Floristic Region of South Africa in October and November of 2023. The campaign collected UV/visible to short wavelength infrared (UVSWIR) and thermal imaging spectroscopy and laser altimetry LiDAR data over terrestrial and aquatic targets using four airborne instruments: AVIRIS-NG, PRISM, LVIS, and HyTES. The airborne data set is unique in its size and scope and unprecedented in its instrument combination and level of detail. These airborne data are accompanied by a range of biodiversity-related field observations. BioSCape’s primary objective is to understand the structure, function, and composition of the region’s ecosystems, and to learn about how and why they are changing in time and space.
Quality Assessment
The PRISM calibration procedure addresses electronic effects involving radiometric responses of each detector, optical effects involving the spatial and spectral view of each detector, and radiometric calibration. Instrument artifacts in the spectrometer data, such as striping, are removed statistically by minimizing a Markov Random Field model. Likewise, bad pixels are identified and corrected using statistical methods followed by laboratory and field protocols to evaluate effectiveness. Details of calibration methods are available in Chapman et al. (2019).
Data Acquisition, Materials, and Methods
South Africa’s Greater Cape Floristic Region (GCFR) is a globally important region for biodiversity with the richest temperate flora and the third highest marine endemism in the world. It contains two Global Biodiversity Hotspots and is experiencing climate-driven changes in biodiversity, which are predicted to continue. GCFR’s vulnerability is compounded by ecological feedbacks between water scarcity, fire, and pressures from human populations.
The BioSCape campaign’s focus was on biological diversity. It spanned both terrestrial and aquatic realms and included research on both plant and animal life. The primary objective for this campaign was to understand the structure, function, and composition of the region’s ecosystems, and to learn about how and why they are changing in time and space. The campaign was organized around three major themes, aimed at understanding:
- the distribution and abundance of biodiversity,
- the role of biodiversity in ecosystem function, and
- the impacts of biodiversity change on ecosystem services.
The experimental design for BioSCape was based on combining in-situ field data with airborne remote sensing data to answer questions about Earth’s natural systems. In October-November 2023, the BioSCape project collected hyperspectral, thermal infrared, and laser altimeter data over the terrestrial and aquatic realms of the GCFR. The airborne instruments deployed include Airborne Visible InfraRed Imaging Spectrometer - Next Generation (AVIRIS-NG), Portable Remote Imaging SpectroMeter (PRISM), Land, Vegetation, and Ice Sensor (LVIS), and Hyperspectral Thermal Emission Spectrometer (HyTES).
PRISM comprises a pushbroom imaging spectrometer covering the near UV to near IR range (350-1050 nm) and a separate spot radiometer covering two short wave infrared (SWIR) bands at 1240 and 1610 nm respectively (Mouroulis et al., 2014). The two-channel radiometer permits accurate atmospheric corrections for ocean color measurements. PRISM offers high temporal resolution and below cloud flight altitudes to resolve spatial features as small as 30 cm. These characteristics make PRISM well suited for studies of aquatic and coastal environments (Thompson et al., 2015). Additional details about the PRISM instrument are available at https://science.nasa.gov/mission/portable-remote-imaging-spectrometer-prism/..
This Level 2A collection contains surface reflectance data for 246 bands in orthocorrected format. L2A reflectances were derived from the associated L1B radiance data (Thompson et al., 2026). The surface reflectance product (RFL_ORT) includes the hemispherical-directional reflectance factor for every pixel in the scene. Reflectance is estimated from at-sensor radiance (Level 1B) using an optimal estimation (OE) based atmospheric correction procedure, fully described in the EMIT Level 2A ATBD (Thompson et al., 2020).
The OE algorithm produces two maps for each pixel; surface reflectance and reflectance uncertainty. The reflectance uncertainty map (UNC_ORT) was derived from the diagonal elements of the posterior covariance matrix, square-rooted, to provide a spectrum of uncertainty about the reflectance estimate in standard deviations units. Together, these two products define the posterior probability of the surface reflectance given the at-sensor radiance measurement, captured as a multivariate normal distribution. Uncertainty-aware downstream analysis of the reflectance map can leverage both products, using the reflectance uncertainty as error bars over the reflectance estimate.
Pixel locations are provided in projected UTM coordinates. Nodata values are set to -9999.
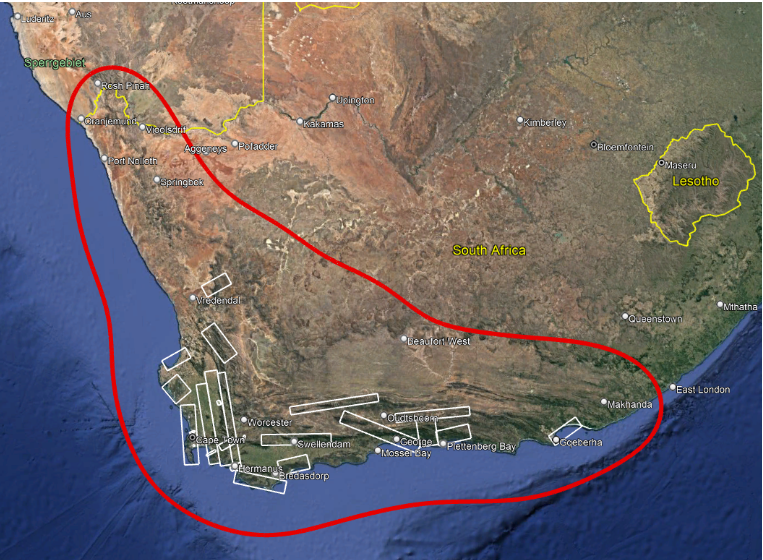
Figure 2. BioSCape study domain (red polygon) over Southern Cape of South Africa. White rectangles show the general locations of planned flight lines. Background image from Google Earth.
Data Access
These data are available through the Oak Ridge National Laboratory (ORNL) Distributed Active Archive Center (DAAC).
BioSCape: PRISM L2A Orthocorrected Surface Reflectance
Contact for Data Center Access Information:
- E-mail: uso@daac.ornl.gov
- Telephone: +1 (865) 241-3952
References
Cardoso, A.W. and The BioSCape Consortium. 2025. BioSCape combines local knowledge and remote-sensing technology for inclusive biodiversity science. Nature Reviews Biodiversity 1:2-4. https://doi.org/10.1038/s44358-024-00007-8
Cardoso, A., E. Hestir, J. Slingsby, C. Forbes, G. Moncrieff, W. Turner, A. Skowno, J. Nesslage, P. Brodrick, K. Gaddis, and A. Wilson. 2025. The biodiversity survey of the Cape (BioSCape), integrating remote sensing with biodiversity science. npj Biodiversity 4:2. https://doi.org/10.1038/s44185-024-00071-5
Chapman, J.W., D.R. Thompson, M.C. Helmlinger, B.D. Bue, R.O. Green, M.L. Eastwood, S. Geier, W. Olson-Duvall, and S.R. Lundeen. 2019. Spectral and Radiometric Calibration of the Next Generation Airborne Visible Infrared Spectrometer (AVIRIS-NG). Remote Sensing 11:2129. https://doi.org/10.3390/rs11182129
Mouroulis, P., B. Van Gorp, R.O. Green, H. Dierssen, D.W. Wilson, M. Eastwood, J. Boardman, B.-C. Gao, D. Cohen, B. Franklin, F. Loya, S. Lundeen, A. Mazer, I. McCubbin, D. Randall, B. Richardson, J.I. Rodriguez, C. Sarture, E. Urquiza, R. Vargas, V. White, and K. Yee. 2014. Portable Remote Imaging Spectrometer coastal ocean sensor: design, characteristics, and first flight results. Applied Optics 53:1363. https://doi.org/10.1364/AO.53.001363
Thompson, D.R, P.G. Brodrick, R.O. Green, O. Kalashnikova, S. Lundeen, G. Okin, W. Olson-Duvall, and T. Painter. 2020. EMIT L2A Algorithm: Surface Reflectance and Scene Content Masks: Theoretical Basis. Version 1.0. Jet Propulsion Laboratory, California Institute of Technology; Pasadena, California. https://earth.jpl.nasa.gov/emit/internal_resources/281
Thompson, D.R., R. Eckert, M. Bernas, P.G. Brodrick, A.M. Chlus, J.W. Chapman, M. Eastwood, H. Bender, S. Geier, E. Greenberg, D. Keymeulen, E. Liggett, W. Olson-Duvall, L.M. Rios, E.D. Brunner, D.J. Jensen, S. Zandbergen, Z. Small, L.A. Shaw, P. Sullivan, Q.P. Vinckier, W. Turner, J.Y. Wang, and R.O. Green. 2026. BioSCape: PRISM L1B Calibrated Radiance. ORNL DAAC, Oak Ridge, Tennessee, USA. https://doi.org/10.3334/ORNLDAAC/2493
Thompson, D.R., F.C. Seidel, B.C. Gao, M.M. Gierach, R.O. Green, R.M. Kudela, and P. Mouroulis. 2015. Optimizing irradiance estimates for coastal and inland water imaging spectroscopy. Geophysical Research Letters 42:4116–4123. https://doi.org/10.1002/2015GL063287