Documentation Revision Date: 2026-06-04
Dataset Version: 1
Summary
There are 5304 files in cloud optimized GeoTIFF format.
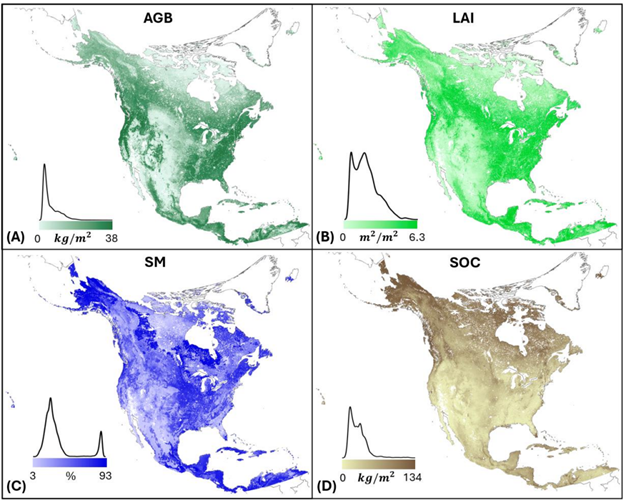
Figure 1. Spatial pattern of ensemble means for aboveground woody biomass (AGB), leaf area index (LAI), soil moisture (SM), and total soil carbon (SOC) across North America captured at the peak of the growing season on July 15, 2024.
Citation
Zhang, D., J. Huggins, Q. Li, S. Ramachandran, S.P. Serbin, C. Webb, Z. Zuo, and M. Dietze. 2026. North American Land Carbon Reanalysis, 2012-2024. ORNL DAAC, Oak Ridge, Tennessee, USA. https://doi.org/10.3334/ORNLDAAC/2507
Table of Contents
- Dataset Overview
- Data Characteristics
- Application and Derivation
- Quality Assessment
- Data Acquisition, Materials, and Methods
- Data Access
- References
Dataset Overview
This dataset provides a gridded ensemble of continental-scale carbon and water budgets at 0.00833-degree (~1 km) resolution across North America from 2012 to 2024. The data streams were generated using a hybrid State Data Assimilation (SDA) framework implemented within the Predictive Ecosystem Analyzer (PEcAn v1.10.0; https://github.com/PecanProject/pecan.git). The system integrates the process-based Simplified Photosynthesis and Evapotranspiration (SIPNET; https://github.com/PecanProject/sipnet.git) model with machine learning emulators (Random Forest) and hierarchical Bayesian inference. The framework harmonizes bottom-up soil properties from SoilGrids with multiple satellite observations, including Landsat (LandTrendr aboveground biomass), MODIS (Leaf Area Index), and SMAP (Root-zone soil moisture), to constrain major carbon and water stocks and reduce spatiotemporal uncertainties across the continent.
This Level 4 product provides annualized snapshots (fixed to July 15th) of critical carbon and water stocks. By combining process modeling with multiple remote sensing observations, it fills a crucial scaling gap between coarse Earth system models and discontinuous raw satellite data. It includes 100 ensemble members and summary statistics (mean and standard deviation) for aboveground woody biomass, leaf area index, root-zone soil moisture, and column-integrated soil organic carbon.
Related Publication
Zhang, D., J. Huggins, Q. Li, S. Ramachandran, S. Serbin, C. Webb, Z. Zuo, and M. Dietze. 2026. Mapping the North American 1 Terrestrial Carbon Cycle: A process-based reanalysis using state data assimilation (SDA). bioRxiv 2026.02.25.708030. https://doi.org/10.64898/2026.02.25.708030
Related Datasets
Duncanson, L., P.M. Montesano, A. Zarringhalam, A. Neuenschwander, J. Armston, T. Feng, E. Guenther, S. Hancock, S.P. Healey, J.R. Kellner, V. Leitold, A. Mandel, D. Minor, M. Purslow, S. Saarela, S. Shah, C.E. Silva, N. Thomas, J.C. White, M.A. Wulder, H.E. Andersen, L. Boschetti, P.A. Fekety, A.T. Hudak, K. Sterenczak, N. Sanchez-Lopez, and J. Wallerman. 2025. Circumpolar Boreal Forest Aboveground Biomass Density, V3. ORNL DAAC, Oak Ridge, Tennessee, USA. https://doi.org/10.3334/ORNLDAAC/2437
Spawn, S.A., and H.K. Gibbs. 2020. Global Aboveground and Belowground Biomass Carbon Density Maps for the Year 2010. ORNL Distributed Active Archive Center. https://doi.org/10.3334/ORNLDAAC/1763
Acknowledgements
This work was supported by NASA's Carbon Monitoring System (CMS) (grant 20-CMS20-0030) and the National Science Foundation's (NSF) Macro-system Biology (MSB) program (grant 2406258).
Data Characteristics
Spatial Coverage: North American continent (covering Canada, USA, Mexico, Central America, the Caribbean, and Greenland)
Spatial Resolution: 0.00833 degree (~1 km)
Temporal Coverage: 2012-07-15 to 2024-07-15
Temporal Resolution: annual, captured on July 15 of each year
Study area (All latitudes and longitudes given in decimal degrees)
| Study Area | Northernmost Latitude | Southernmost Latitude | Westernmost Longitude | Easternmost Longitude |
|---|---|---|---|---|
| North American continent | 85 | 7 | -179 | -20 |
Data File Information
There are 5304 files in cloud optimized GeoTIFF format. Each file holds values for the relevant variable estimated for the peak of the growing season, July 15, of the specified year.
The file naming convention is NA_Land_Carbon_<ensemble>_<year>_<metric>.tif, where
- <ensemble> = model ensemble identifier (1 to 100) or summary statistic across ensemble members: mean ("mean") or standard deviation ("std")
- <year> = year: 2012 to 2024
- <metric> = variable estimated (see abbreviations in Table 1)
Example file name: NA_Land_Carbon_100_2012_LAI.tif
GeoTIFF characteristics
- Coordinate system:Geographic coordinates using WGS 84 datum (EPSG 4326)
- Spatial resolution: 0.00833 degree (approximately 1 km)
- Dimensions: 19,080 columns x 9360 rows
- Pixel values: see Table 1.
- Single band in each file.
- Nodata value: -9999
Table 1. Variables in GeoTIFFs
| Variable | Abbreviation | Units | Description |
|---|---|---|---|
| Aboveground biomass | AbvGrndWood | Mg C ha-1 | Total carbon density stored in aboveground woody biomass. |
| Leaf Area Index | LAI | m2 m-2 | One-sided green leaf area per unit ground surface area. |
| Soil Moisture | SoilMoistFrac | percent | Volumetric soil water content in the root zone (0–100 cm depth), expressed as percent. |
| Soil Organic Carbon | TotSoilCarb | kg C m-2 | Column-integrated soil organic carbon stock to 200-cm depth. |
Application and Derivation
This dataset serves as a high-resolution benchmark for Carbon Monitoring, Reporting, and Verification (MRV) frameworks across North America. It can be directly utilized as an optimized land prior for atmospheric inversion studies, coupled land-atmosphere data assimilation systems, and regional carbon accounting projects. By explicitly providing pixel-level spatial covariances, it allows users to aggregate uncertainties accurately across large geographic or administrative boundaries.
Quality Assessment
Uncertainties were systematically tracked and propagated across a 100-member model ensemble using the Tobit Gamma Ensemble Filter (TGEnF). The state data assimilation workflow achieved major reductions in uncertainty relative to the raw input observation streams: pixel-level aboveground woody biomass (AGB) uncertainty was reduced by an average of 82.4% compared to the assimilated LandTrendr product, while soil organic carbon (SOC) uncertainty saw a 77.0% reduction relative to baseline SoilGrids estimates.
The final reanalysis grids were validated against independent, held-out ground measurements and spaceborne LiDAR platforms. Aboveground biomass estimates align closely with the USFS Forest Inventory and Analysis (FIA) BIGMAP database R2 = 0.74) and combined GEDI/ICESat-2 LiDAR products R2 = 0.73). Soil organic carbon stocks were validated regionally against actual core sample measurements from the International Soil Carbon Network (ISCN) database R2 = 0.44).
Known Limitations: A structural data discontinuity impacts temporal trends around 2017–2018 due to an underlying change in the input LandTrendr source data stream within the CONUS region. Additionally, optical remote sensing saturation limits cause the framework to slightly underestimate aboveground biomass in exceptionally high-density forest systems (such as the temperate rainforests of the Pacific Northwest and dense tropical broadleaf forests where AGB >15 kg C m-2).
Data Acquisition, Materials, and Methods
This dataset provides a gridded ensemble of continental-scale carbon and water budgets at 0.00833-degree (~1 km) resolution across North America from 2012 to 2024. The data streams were generated using a hybrid State Data Assimilation (SDA) framework implemented within the Predictive Ecosystem Analyzer (PEcAn v1.10.0; https://github.com/PecanProject/pecan.git). The system integrates the process-based Simplified Photosynthesis and Evapotranspiration (SIPNET; https://github.com/PecanProject/sipnet.git) model with machine learning emulators (Random Forest) and hierarchical Bayesian inference. The framework harmonizes bottom-up soil properties from SoilGrids with multiple satellite observations, including Landsat (LandTrendr aboveground biomass), MODIS (Leaf Area Index), and SMAP (Root-zone soil moisture), to constrain major carbon and water stocks and reduce spatiotemporal uncertainties across the continent.
This Level 4 product provides annualized snapshots (fixed to July 15th) of critical carbon and water stocks. By combining process modeling with multiple remote sensing observations, it fills a crucial scaling gap between coarse Earth system models and discontinuous raw satellite data. It includes 100 ensemble members and summary statistics (mean and standard deviation) for aboveground woody biomass, leaf area index, root-zone soil moisture, and column-integrated soil organic carbon. The mean and standard deviation were computed across ensemble members for each year and variable.
Site Stratification: To manage computational costs while capturing environmental heterogeneity, a hierarchical k-means clustering algorithm classified North America into representative eco-climatic zones across 8,000 distinct locations.
Process Modeling: At each selected point, the Simplified Photosynthesis and Evapotranspiration (SIPNET; Longfritz et al., 2025) biosphere model was executed using hourly meteorological forcing from the ERA5 atmospheric reanalysis.
State Data Assimilation: As annual satellite streams became available at peak growing season (July 15th), the Tobit Gamma Ensemble Filter (TGEnF) sequentially adjusted model state vectors to match observations of aboveground woody biomass (AGB), leaf area index (LAI), soil moisture (SM), and soil organic carbon (SOC).
Machine Learning Debiasing: A Random Forest algorithm was integrated iteratively into the loop to identify and subtract systematic autocorrelative process-model errors using lagged spatial covariates.
Spatial Scaling: Finally, an optimized spatial Random Forest emulator learned the relationships between the 8,000 point-based posterior states and continent-wide environmental covariates (including SoilGrids properties, topography, and annualized climate metrics) to interpolate the final contiguous 1-km gridded maps.
See Zhang et al. (2026a) for additional information and Zhang et al. (2026b) for details of methods.
Data Access
These data are available through the Oak Ridge National Laboratory (ORNL) Distributed Active Archive Center (DAAC).
North American Land Carbon Reanalysis, 2012-2024
Contact for Data Center Access Information:
- E-mail: uso@daac.ornl.gov
- Telephone: +1 (865) 241-3952
References
Duncanson, L., P.M. Montesano, A. Neuenschwander, N. Thomas, A. Mandel, D. Minor, E. Guenther, S. Hancock, T. Feng, A. Barciauskas, G.W. Chang, S. Shah, and B.P. Satorius. 2023. Aboveground Biomass Density for High Latitude Forests from ICESat-2, 2020. ORNL Distributed Active Archive Center. https://doi.org/10.3334/ORNLDAAC/2186
Longfritz, M.J., W.J. Sacks, D.J.P. Moore, J.M. Zobitz, B.H. Braswell, D.S. Schimel, R. Kooper, M.C. Dietze, I. Fer, C. Black, and D.S. LeBauer. 2025. SIPNET: Simple Photosynthesis and Evapotranspiration Model (v2.0.0). https://doi.org/10.5281/zenodo.17148669
Spawn, S.A., and H.K. Gibbs. 2020. Global Aboveground and Belowground Biomass Carbon Density Maps for the Year 2010. ORNL Distributed Active Archive Center. https://doi.org/10.3334/ORNLDAAC/1763
Zhang, D., Q. Li, A. Helgeson, S.P. Serbin, and M. Dietze. 2026a. Harmonizing terrestrial carbon cycle observations over CONUS NEON sites: assessing the information contributions of multiple data constraints. Global Change Biology 32:e70761. https://doi.org/10.1111/gcb.70761
Zhang, D., J. Huggins, Q. Li, S. Ramachandran, S. Serbin, C. Webb, Z. Zuo, and M. Dietze. 2026b. Mapping the North American 1 Terrestrial Carbon Cycle: A process-based reanalysis using state data assimilation (SDA). bioRxiv 2026.02.25.708030. https://doi.org/10.64898/2026.02.25.708030