Documentation Revision Date: 2026-07-31
Dataset Version: 1
Summary
This dataset contains 329 data files in netCDF-4 (*.nc) format and one companion file in PDF (*.pdf) format.
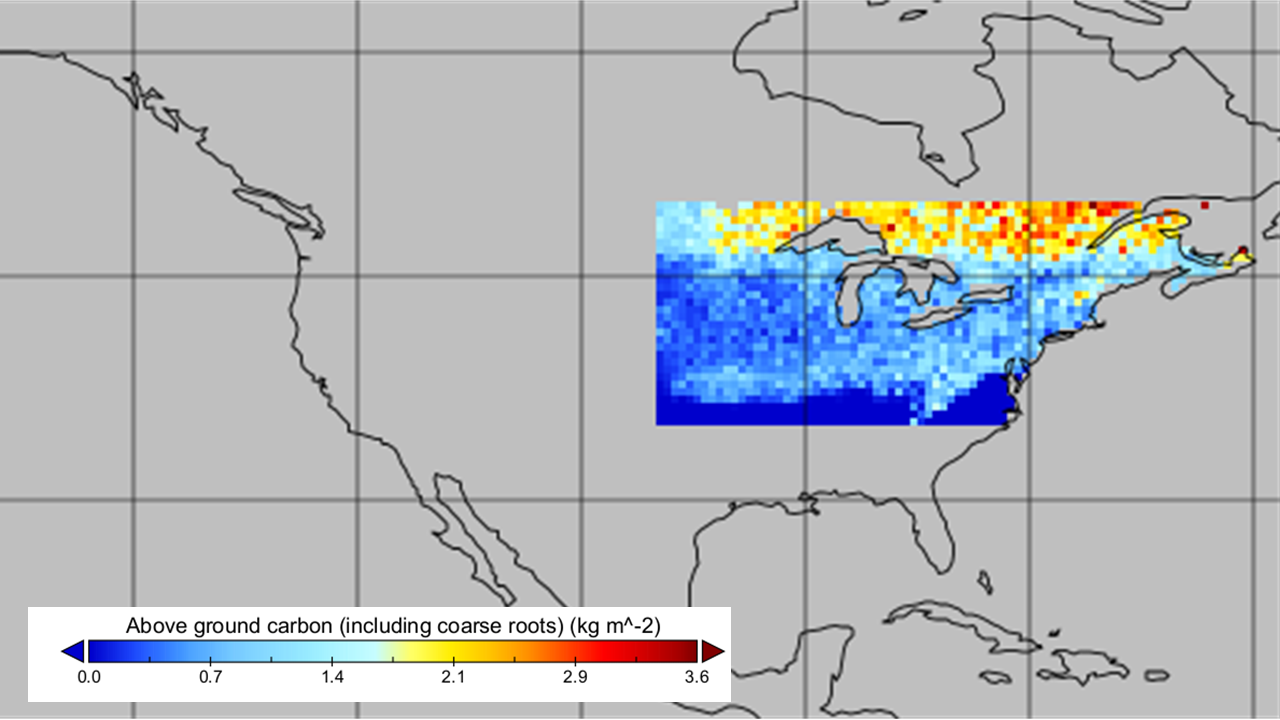
Figure 1. Aboveground biomass (including coarse roots) estimates in 2000 derived from the LPJ-GUESS model.
Citation
Rollinson, C., M. Dietze, B. Brooks, T. Hickler, Y. Liu, J.H. Matthes, J. Mclachlan, D.J.P. Moore, B. Poulter, T. Quaife, A.M. Raiho, K. Schaefer, and J. Steinkamp. 2026. PalEON: Terrestrial Ecosystem Model Outputs for the Northeastern U.S., 0850-2010. ORNL DAAC, Oak Ridge, Tennessee, USA. https://doi.org/10.3334/ORNLDAAC/2509
Table of Contents
- Dataset Overview
- Data Characteristics
- Application and Derivation
- Quality Assessment
- Data Acquisition, Materials, and Methods
- Data Access
- References
Dataset Overview
This dataset from the PalEON (Paleo-Ecological Observatory Network) Ecosystem Model Intercomparison Project (PEMIP) provides site-specific and regional outputs from terrestrial ecosystem model simulations in the Northeastern U.S. over the time period 0850-01-01 to 2010-12-31. For the regional scale modeling effort, five ecosystem models participated: ED2, LINKAGES, LPJ-GUESS, LPJ-WSL, and TRIFFID. Additional output for a larger ensemble is available for six individual sites with the following models: CLM-BGC, CLM-CN, ED2, ED2-landuse, JULES, TRIFFID, LINKAGES, LPJ-GUESS, LPJ-WSL, SiBCASA. Output variables include key terrestrial ecosystem metrics, such as aboveground biomass, autotrophic respiration, evaporation, gross primary productivity, net ecosystem exchange, and net primary productivity (output variables differ by model). The PEMIP is a coordinated effort to develop a set of terrestrial ecosystem model simulations with the ability to evaluate high-resolution ecophysiological causes and consequences of forest responses to climatic variability and change over the past millennium.
Project: North American Carbon Program
The North American Carbon Program (NACP) is a multidisciplinary research program designed to improve understanding of North America's carbon sources, sinks, and stocks. The central objective is to measure and understand the sources and sinks of Carbon Dioxide (CO2), Methane (CH4), and Carbon Monoxide (CO) in North America and adjacent oceans. NACP is supported by a number of different federal agencies. NACP data holdings include atmospheric observations, remote sensing products, field measurements, inventories, and model outputs supporting carbon-cycle synthesis and inter-comparison.
Related Publications
Rollinson, C.R., A. Dawson, A. Raiho, J.W. Williams, M.C. Dietze, T. Hickler, S.T. Jackson, J. McLachlan, D.J.P. Moore, B. Poulter, T. Quaife, J. Steinkamp, and M. Trachsel. 2021. Forest responses to last-millennium hydroclimate variability are governed by spatial variations in ecosystem sensitivity. Ecology Letters 24:498-508. https://doi.org/10.1111/ele.13667
Rollinson, C.R., Y. Liu, A. Raiho, D.J.P. Moore, J. McLachlan, D.A. Bishop, A. Dye, J.H. Matthes, A. Hessl, T. Hickler, N. Pederson, B. Poulter, T. Quaife, K. Schaefer, J. Steinkamp, and M.C. Dietze. 2017. Emergent climate and CO2 sensitivities of net primary productivity in ecosystem models do not agree with empirical data in temperate forests of eastern North America. Global Change Biology 23:2755-2767. https://doi.org/10.1111/gcb.13626
Related Datasets
Rollinson, C., M. Dietze, J.H. Mathes, J. Steinkamp, T. Hickler, B. Poulter, A.M. Raiho, J. Mclachlan, T. Quaife, Y. Liu, D.J.P. Moore, K. Schaefer, and B. Brooks. 2023. PalEON: Terrestrial Ecosystem Model Drivers for the Northeastern U.S., 0850-2010. ORNL DAAC, Oak Ridge, Tennessee, USA. https://doi.org/10.3334/ORNLDAAC/1779
- This dataset holds the model driver data used by the PalEON Ecosystem Model Intercomparison Project (PEMIP)
Ramankutty, N., J.A. Foley, F.G. Hall, G.J. Collatz, B.W. Meeson, S.O. Los, E.Brown De Colstoun, and D.R. Landis. 2010. ISLSCP II Potential Natural Vegetation Cover. ORNL DAAC, Oak Ridge, Tennessee, USA. https://doi.org/10.3334/ORNLDAAC/961
Wei, Y., Shishi Liu, D.N. Huntzinger, A.M. Michalak, N. Viovy, W.M. Post, C.R. Schwalm, K. Schaefer, A.R. Jacobson, C. Lu, H. Tian, D.M. Ricciuto, R.B. Cook, J. Mao, and X. Shi. 2014. NACP MsTMIP: Global and North American Driver Data for Multi-Model Intercomparison. ORNL DAAC, Oak Ridge, Tennessee, USA. https://doi.org/10.3334/ORNLDAAC/1220
Data Characteristics
Spatial Coverage: north central and northeastern U.S.
Spatial Resolution: 0.5 degree and point resolution
Temporal Coverage: 0850-01-01 to 2010-12-31
Temporal Resolution: annual, monthly, daily, or 3-hour
Study Area: Latitude and longitude are given in decimal degrees.
| Site | Northernmost Latitude | Southernmost Latitude | Easternmost Longitude | Westernmost Longitude |
|---|---|---|---|---|
| north central and northeastern U.S. | 50 | 35 | -60 | -100 |
Data File Information
This dataset contains 329 data files in netCDF-4 (*.nc) format from 5 regional models and 10 site models. The files are named paleon_<type>_<model>_<site>_<resolution>_<range>.nc, where
- <type> is the spatial extent, either "site" or "region" (regional)
- <model> is the model used (see Table 1)
- <site> is the site abbreviation (see Table 2). This element is only present in the site files. An ‘S’ is appended to the beginning of the site code indicating sub-daily model outputs.
- <resolution> is the temporal resolution: "3hour", "annual", "daily", "monthly"
- <range> is the temporal coverage and YYYY represents a four-digit year.
Data File Details
- Generally, region files contain 30 rows and 80 columns, and site files are a single tile
- Missing values are defined in the ‘missing_value’ and/or ‘fill_value’ attribute.
- The coordinate reference system is longitude - latitude using the WGS 84 datum (EPSG:4326).
Table 1. Models included in PEMIP. Note the version (‘v’) in the abbreviation often references the modeling team’s version/run rather than the published model version. See Model_Description_Readmes.pdf for additional details.
| Model Name | Abbreviation used in Regional File Names | Abbreviation Used in Site File Names | Reference |
|---|---|---|---|
| Community Land Model (CLM) 4.5 with biogeochemistry (BGC) | N/A | CLM45BGC-v5-1 | Oleson et al., 2013 |
| CLM 4.5 with carbon, nitrogen, (CN), and biogeochemistry | N/A | CLM45CN-v3-1 | Oleson et al., 2013 |
| Ecosystem Demography Model (ED) version 2.1 | ED2-v1 | ED2-v7 | Moorcroft et al., 2001; Medvigy et al., 2009 |
| ED 2.1 Land Use (LU) | N/A | ED2-LU-v8 | Moorcroft et al., 2001; Medvigy et al., 2009 |
| JULES (Joint UK Land Environment Simulator) | N/A | JULES-STATIC | Best et al., 2011; Clark et al., 2011 |
| JULES Top-down Representation of Interactive Foliage and Flora Including Dynamics (TRIFFID) | TRIFFID | JULES-TRIFFID-v1 | Best et al., 2011; Clark et al., 2011 |
| Linking Inherently Nonlinear K Among Gradients and EcoSystems (LINKAGES) version 1.3 | LINKAGES | LINKAGES-v2-1 | Post and Pastor, 2013 |
| Lund–Potsdam–Jena – Wald, Schnee, Landschaft (LPJ-WSL) | LPJ-WSL-v1 | LPJ-WSL-v6 | Gerten et al., 2004; Sitch et al., 2003 |
| Lund-Potsdam-Jena General Ecosystem Simulator (LPJ-GUESS) SVN revision 3826 | LPJ-GUESS | LPJ-GUESS-v6 | Gerten et al., 2004; Sitch et al., 2003; Smith et al., 2001; Smith et al., 2014 |
| Simple Biosphere/Carnegie-Ames-Stanford Approach (SiBCASA) | N/A | SiBCASA-v1 | Schaefer et al., 2008 |
Table 2. Site in the site-level model-intercomparison portion of PEMIP
| Site Abbreviation | Site Name | PalEON Site | Latitude | Longitude |
|---|---|---|---|---|
| PHA | Harvard Forest | Highly Integrated Proxy Site (HIPS) | 42.54 | -72.18 |
| PHO | Howland Forest | HIPS | 45.25 | -68.73 |
| PUN | University of Notre Dame Environmental Research Center (UNDERC) – East | HIPS | 46.22 | -89.53 |
| PBL | Billy’s Lake | Intensive pollen sites (Pollen) | 46.28 | -94.58 |
| PDL | Deming Lake | Pollen | 47.17 | -95.17 |
| PMB | Minden Bog | Pollen | 43.61 | -82.83 |
Table 3. Data dictionary for all files
| Variable | Units | Description |
|---|---|---|
| AGB | kgC m-2 | Total aboveground biomass |
| AutoResp | kgC m-2 s-1 | Autotrophic respiration rate |
| BA | m2 ha-1 | Basal area by plant functional type (PFT) |
| CarbPools | kgC m-2 | Carbon in Each Model Carbon Pool |
| CO2 | ppm | Carbon dioxide concentration in the air |
| CWDI | kgC m-2 month-1 | Coarse woody debris increment. Analogous to flux of woody material to the detrital pool resulting from mortality; corresponds to GWBI |
| Dens | ha-1 | Stem Density by PFT |
| Estab | ha-1 | New individuals |
| Evap | kg m-2 s-1 | Total evaporation. Sum of evaporative sources minus transpiration |
| Fcomp | kgC kgC-1 | AGB fractional composition of each PFT within each grid cell. |
| Fire | kgC m-2 s-1 | Fire emissions |
| GPP | kgC m-2 s-1 | Gross primary productivity |
| GWBI | kgC m-2 month-1 | Gross woody biomass increment (analogous to tree-ring derived biomass) |
| HeteroResp | kgC m-2 s-1 | Heterotrophic respiration |
| LAI | m2 m-2 | Leaf area index |
| LW_albedo | 1 | Longwave albedo |
| lwdown | W m-2 | Incident longwave radiation averaged over the time step of the forcing data |
| LWnet | W m-2 | Net downward longwave radiation at surface |
| Mort | ha-1 | Mortality. Number of individuals lost through death. |
| NEE | kgC m-2 s-1 | Net ecosystem exchange |
| NPP | kgC m-2 s-1 | Net primary production of each PFT within each grid cell. |
| PFT | - | Name of each plant functional type (PFT) or species included in the model. |
| poolname | - | Names of each vegetation and soil carbon pool |
| precipf | kg m-2 s-1 | The per unit area and time precipitation representing the sum of convective rainfall stratiform rainfall and snowfall |
| psurf | Pa | Pressure at the surface |
| qair | kg kg-1 | Specific humidity measured at the lowest level of the atmosphere |
| Qh | W m-2 | Surface sensible heat flux for land tiles |
| Qle | W m-2 | Surface latent heat flux for land tiles |
| Qs | kg m-2 s-1 | Baseflow (lateral subsurface runoff) |
| Qsb | kg m-2 s-1 | Drainage and subsurface lateral flow |
| SnowDepth | kg m-2 | Snow depth (on ground) |
| SoilDepth | m | Depth to the bottom of each model-defined soil layer. |
| SoilMoist | kg m-2 | Soil water content in each model-defined soil layer. |
| SoilTemp | K | Soil temperature in each model-defined soil layer. |
| SW_albedo | 1 | Albedo (as used for net shortwave calculation) |
| swdown | W m-2 | Incident radiation in the shortwave part of the spectrum averaged over the time step of the forcing data |
| SWE | kg m-2 | Total water mass (ice plus liquid) |
| SWnet | W m-2 | Net Shortwave Radiation |
| tair | K | Nar surface air temperature (at 2 m) |
| time | Years/months/days since YYYY-MM-DD or seconds since YYYY-MM-DD HH:MM:SS | Timestep. The units are specifically defined in the ‘units’ variable attribute. Note: Some files have multiple time variables and dimensions such as ‘time.months’ and ‘time.years’ |
| TotLivBiom | kgC m-2 | Total carbon content of living biomass (e.g. leaf +root+wood) |
| TotSoilCarb | kgC m-2 | Total soil and litter cabon content over the entire soil profile |
| Transp | kg m-2 s-1 | Transpiration of each PFT within each grid cell. |
| wind | m s-1 | Wind speed measured with a vertical coordinate in height of 10 m |
Companion Files
This companion file Model_Description_Readmes.pdf contains text from readme files that modeling teams submitted holding metadata surrounding the individual modeling approaches.
Application and Derivation
Exposure to 21st-century climate change is expected to profoundly impact global forest composition, diversity, and structure, but the sensitivity of ecosystems to climate variability at multi-decadal to centennial time scales is poorly constrained by instrumental observations. Terrestrial ecosystem models used to forecast responses to climate change often have difficulty reproducing broad-scale and long-term responses to environmental variability, despite being well-grounded in empirical evidence and ecological theory. Moreover, there are several challenges that hinder the joint analysis and integration of terrestrial ecosystem models and palaeoecological data to better constrain modeled responses to climate variations at multi-decadal and longer timescales.
These data were used in the related publication by Rollinson et al. (2021), to establish the patterns of forest ecosystem and climate variability in the north-central and northeastern U.S. for the last millennium (850–1850 C.E.) and identify the mechanisms underpinning both forest ecosystem sensitivity and observed data-model discrepancies. A combination of data-model and model-model comparisons of palaeoclimatic and palaeoecological datasets was used (Figure 2). The results indicate that at centennial timescales, spatial patterns in the variability of forest composition and biomass are regulated by ecological factors such as ecotonal position and complexity rather than climate exposure as defined by the local magnitude of climate variability.
Quality Assessment
No quality assessment is available for this dataset.
Data Acquisition, Materials, and Methods
This dataset includes site and regional model outputs that have a consistent spatial extent, resolution, and coordinate reference system. The environmental and meteorological drivers used to derive these outputs are available in Rollinson et al. (2023). Details about the drivers and outputs are available in Rollinson et al. (2021).
The PalEON (Paleo-Ecological Observatory Network) Ecosystem Model Intercomparison Project (PEMIP) is an interdisciplinary team of paleoecologists, ecological statisticians, and ecosystem modelers from across a number of institutions began in the early 1990s to provide an efficient mechanism for coordinating palaeoclimate modeling activities (Braconnot et al., 2021). The goal of the PEMIP is to reconstruct forest composition, fire regime, and climate in forests across the northeastern U.S. and Alaska over the past 2,000 years and use the results to drive and validate terrestrial ecosystem models (Figure 2).
Ten models across six sites (i.e., site extent models) were included in PEMIP to serve as a baseline for the regional extent models. There were five models at the regional extent covering north-central and northeastern U.S. Outputs were standardized to adhere to a common naming convention following ALMA standard names (https://web.lmd.jussieu.fr/~polcher/ALMA/convention_output_3.html) and NetCDF (*.nc) file structure. Specific details on each model are contained in the companion file.
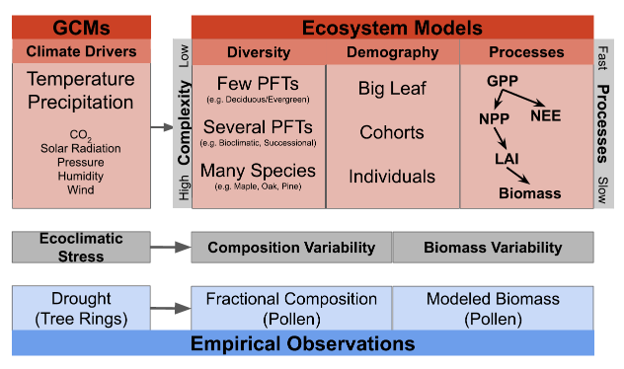
Figure 2. Overview of the unified conceptual framework (grey boxes) for parallel analysis of empirical data (blue boxes) and model output (red boxes) described in the study by Rollinson et al. (2021). For ecosystem models, the latent climatic and ecosystem processes are described for unobservable palaeoecological data and differences among models in complexity. Complexity is organized into three categories: 1) diversity, ranging from a few plant functional types (PFTs) to many species; 2) demography, ranging from "big leaf" models with no explicit treatment of forest demography to models with individual trees and 3) ecophysiological processes. Changes in forest biomass emerge from latent ecophysiological processes including gross primary productivity (GPP), net primary productivity (NPP), net ecosystem exchange (NEE), and leaf area index (LAI). Ecophysiological processes are controlled by the model representation of higher-level vegetation processes. Latent model drivers, processes, and states (red boxes) result in estimates of forest composition and biomass that can be compared to palaeoecological data products (blue boxes). Models vary in complexity due to design philosophy and trade-offs between model complexity and computational speed.
Data Access
These data are available through the Oak Ridge National Laboratory (ORNL) Distributed Active Archive Center (DAAC).
PalEON: Terrestrial Ecosystem Model Outputs for the Northeastern U.S., 0850-2010
Contact for Data Center Access Information:
- E-mail: uso@daac.ornl.gov
- Telephone: +1 (865) 241-3952
References
Best, M.J., M. Pryor, D.B. Clark, G.G. Rooney, R.L. H. Essery, C.B. Ménard, J.M. Edwards, M.A. Hendry, A. Porson, N. Gedney, L.M. Mercado, S. Sitch, E. Blyth, O. Boucher, P.M. Cox, C.S. B. Grimmond, and R.J. Harding. 2011. The Joint UK Land Environment Simulator (JULES), model description – Part 1: Energy and water fluxes. Geoscientific Model Development 4:677–699. https://doi.org/10.5194/gmd-4-677-2011
Braconnot, P., S. Harrison, M. Kageyama, P.J. Bartlein, V. Masson-Delmotte, A. Abe-Ouchi, B. Otto-Bliesner, and Y. Zhao. 2021. Evaluation of climate models using palaeoclimatic data. Nature Climate Change 2:417-424. https://doi.org/10.1038/nclimate1456
Clark, D.B., L.M. Mercado, S. Sitch, C.D. Jones, N. Gedney, M.J. Best, M. Pryor, G.G. Rooney, R.L. H. Essery, E. Blyth, O. Boucher, R.J. Harding, C. Huntingford, and P.M. Cox. 2011. The Joint UK Land Environment Simulator (JULES), model description – Part 2: Carbon fluxes and vegetation dynamics. Geoscientific Model Development 4:701–722. https://doi.org/10.5194/gmd-4-701-2011
Gerten, D., S. Schaphoff, U. Haberlandt, W. Lucht, and S. Sitch. 2004. Terrestrial vegetation and water balance—hydrological evaluation of a dynamic global vegetation model. Journal of Hydrology 286:249–270. https://doi.org/10.1016/j.jhydrol.2003.09.029
Medvigy, D., S.C. Wofsy, J.W. Munger, D.Y. Hollinger, and P.R. Moorcroft. 2009. Mechanistic scaling of ecosystem function and dynamics in space and time: Ecosystem Demography model version 2. Journal of Geophysical Research 114:G01002. https://doi.org/10.1029/2008JG000812
Moorcroft, P.R., G.C. Hurtt, and S.W. Pacala. 2001. A method for scaling vegation dynamics: the ecosystem demography model (ED). Ecological Monographs 71:556-586. https://doi.org/10.1890/0012-9615(2001)071[0557:AMFSVD]2.0.CO;2
Oleson, K., D. Lawrence, G. Bonan, B. Drewniak, M. Huang, C. Koven, S. Levis, F. Li, W. Riley, Z. Subin, S. Swenson, P. Thornton, A. Bozbiyik, R. Fisher, C. Heald, E. Kluzek, J.-F. Lamarque, P. Lawrence, L. Leung, W. Lipscomb, S. Muszala, D. Ricciuto, W. Sacks, Y. Sun, J. Tang, and Z.-L. Yang. 2013. Technical description of version 4.5 of the Community Land Model (CLM). NSF National Center for Atmospheric Research. https://doi.org/10.5065/D6RR1W7M
Post, W. M., and J. Pastor. 2013. LINKAGES: An Individual-based Forest Ecosystem Biogeochemistry Model (Version 1). ORNL Distributed Active Archive Center. https://doi.org/10.3334/ORNLDAAC/1166
Ramankutty, N., J.A. Foley, F.G. Hall, G.J. Collatz, B.W. Meeson, S.O. Los, E.Brown De Colstoun, and D.R. Landis. 2010. ISLSCP II Potential Natural Vegetation Cover. ORNL DAAC, Oak Ridge, Tennessee, USA. https://doi.org/10.3334/ORNLDAAC/961
Rollinson, C.R., A. Dawson, A. Raiho, J.W. Williams, M.C. Dietze, T. Hickler, S.T. Jackson, J. McLachlan, D.J.P. Moore, B. Poulter, T. Quaife, J. Steinkamp, and M. Trachsel. 2021. Forest responses to last-millennium hydroclimate variability are governed by spatial variations in ecosystem sensitivity. Ecology Letters 24:498-508. https://doi.org/10.1111/ele.13667
Rollinson, C., M. Dietze, J.H. Mathes, J. Steinkamp, T. Hickler, B. Poulter, A.M. Raiho, J. Mclachlan, T. Quaife, Y. Liu, D.J.P. Moore, K. Schaefer, and B. Brooks. 2023. PalEON: Terrestrial Ecosystem Model Drivers for the Northeastern U.S., 0850-2010. ORNL DAAC, Oak Ridge, Tennessee, USA. https://doi.org/10.3334/ORNLDAAC/1779
Rollinson, C.R., Y. Liu, A. Raiho, D.J.P. Moore, J. McLachlan, D.A. Bishop, A. Dye, J.H. Matthes, A. Hessl, T. Hickler, N. Pederson, B. Poulter, T. Quaife, K. Schaefer, J. Steinkamp, and M.C. Dietze. 2017. Emergent climate and CO2 sensitivities of net primary productivity in ecosystem models do not agree with empirical data in temperate forests of eastern North America. Global Change Biology 23:2755-2767. https://doi.org/10.1111/gcb.13626
Sitch, S., B. Smith, I.C. Prentice, A. Arneth, A. Bondeau, W. Cramer, J.O. Kaplan, S. Levis, W. Lucht, M.T. Sykes, K. Thonicke, and S. Venevsky. 2003. Evaluation of ecosystem dynamics, plant geography and terrestrial carbon cycling in the LPJ dynamic global vegetation model. Global Change Biology 9:161–185. https://doi.org/10.1046/j.1365-2486.2003.00569.x
Schaefer, K., G.J. Collatz, P. Tans, A.S. Denning, I. Baker, J. Berry, L. Prihodko, N. Suits, and A. Philpott. 2008. Combined Simple Biosphere/Carnegie-Ames-Stanford Approach terrestrial carbon cycle model. Journal of Geophysical Research: Biogeosciences 113:G03034. https://doi.org/10.1029/2007JG000603
Smith, B., I.C. Prentice, and M.T. Sykes. 2001. Representation of vegetation dynamics in the modelling of terrestrial ecosystems: comparing two contrasting approaches within European climate space. Global Ecology and Biogeography 10:621-637. http://www.jstor.org/stable/3182691
Smith, B., D. Wårlind, A. Arneth, T. Hickler, P. Leadley, J. Siltberg, and S. Zaehle. 2014. Implications of incorporating N cycling and N limitations on primary production in an individual-based dynamic vegetation model. Biogeosciences 11:2027–2054. https://doi.org/10.5194/bg-11-2027-2014
Wei, Y., S. Liu, D.N. Huntzinger, A.M. Michalak, N. Viovy, W.M. Post, C.R. Schwalm, K. Schaefer, A.R. Jacobson, C. Lu, H. Tian, D.M. Ricciuto, R.B. Cook, J. Mao, and X. Shi. 2014. NACP MsTMIP: Global and North American Driver Data for Multi-Model Intercomparison. ORNL DAAC, Oak Ridge, Tennessee, USA. https://doi.org/10.3334/ORNLDAAC/1220