Documentation Revision Date: 2026-08-13
Dataset Version: 4
Summary
There are 275 files in these dataset including two files in comma-separated values (CSV) format and 273 GeoTIFFs. Each GeoTIFF contains fossil fuel CO2 annual emissions for a given economic sector for each year for the period 2010-2022 (13 years) for the contiguous United States and Alaska; there are no data for Alaska for the cement industry.
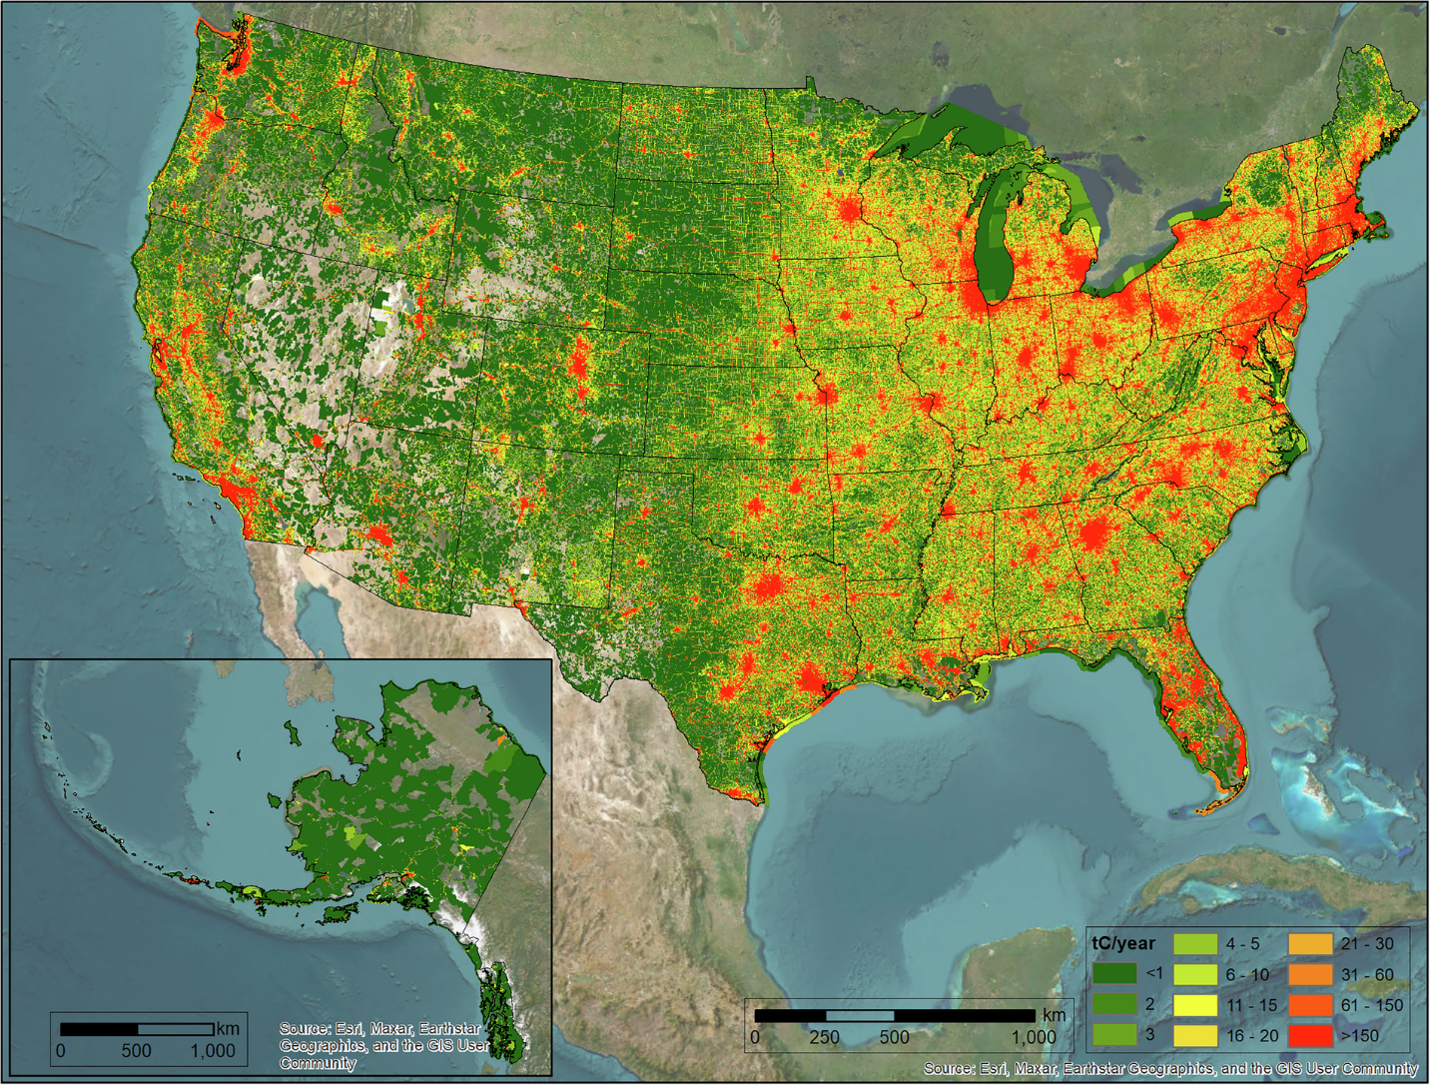
Figure 1. Vulcan 2022 FFCO2 emissions in units of metric tons of carbon per 1 km2 gridcell for the contiguous United States and Alaska (tC km-2). Image source: Gurney et al. (2025).
Citation
Gurney, K.R., and L. Gawuc. 2026. Vulcan: High-Resolution Annual Fossil Fuel CO2 Emissions in USA, 2010-2022. ORNL DAAC, Oak Ridge, Tennessee, USA. https://doi.org/10.3334/ORNLDAAC/2505
Table of Contents
- Dataset Overview
- Data Characteristics
- Application and Derivation
- Quality Assessment
- Data Acquisition, Materials, and Methods
- Data Access
- References
- Dataset Revisions
Dataset Overview
This dataset provides estimates of annual carbon dioxide emissions due to the combustion of fossil fuel and cement production in the contiguous United States and Alaska spanning the 2010-2022 time period. The Vulcan FFCO2 version 4.0 model was used to generate emissions using a bottom-up/engineering approach, which is best described as a fusion of data and modeling components. The native spatial resolution of the Vulcan FFCO2 emissions data product is a combination of points, lines, and polygons dictated primarily by the underlying data sources. The FFCO2 emissions are placed into a regularized continuous gridded 1-km x 1-km landscape for ease of analysis and incorporation into atmospheric transport modeling efforts. Referred to as FFCO2, the emissions are categorized into 10 source sectors including residential, commercial, industrial, electricity production, on-road, nonroad, commercial marine vessel, airport, rail, and cement. Total emissions from all source sectors combined are included. Tabular summaries aggregated to state and county levels are also provided.
This is version 4 of this dataset.
Project: North American Carbon Program (NACP)
The North American Carbon Program (NACP) is a multidisciplinary research program designed to improve understanding of North America's carbon sources, sinks, and stocks. The central objective is to measure and understand the sources and sinks of carbon dioxide (CO2), methane (CH4), and carbon monoxide (CO) in North America and adjacent oceans. NACP is supported by a number of different federal agencies. NACP data holdings include atmospheric observations, remote sensing products, field measurements, inventories, and model outputs supporting carbon-cycle synthesis and inter-comparison.
Related Dataset
Gurney, K.R., J. Liang, R. Patarasuk, Y. Song, J. Huang, and G. Roest. 2019. Vulcan: High-Resolution Annual Fossil Fuel CO2 Emissions in USA, 2010-2015, Version 3. ORNL DAAC, Oak Ridge, Tennessee, USA. https://doi.org/10.3334/ORNLDAAC/1741
- Version 3 of this dataset
Related Publication
Gurney, K.R., P. Dass, A. Kato, L. Gawuc, B. Aslam, and S. Huilin. 2025. Vulcan version 4.0 high-resolution annual carbon dioxide emissions in the U.S. for the 2010–2022 time period. Scientific Data 12:1946. https://doi.org/10.1038/s41597-025-06391-w
Acknowledgements
The Vulcan v4.0 data product was made possible through support from the National Oceanic and Atmospheric Administration (grants NA19OAR4310167 and NA20OAR4310297). This dataset is archived in support of the NASA North American Carbon Program (NACP).
Data Characteristics
Spatial Coverage: Contiguous United States and Alaska
Spatial Resolution: 1 km
Temporal Coverage: 2010 - 2022
Temporal Resolution: Annual
Study Area: Latitude and longitude are given in decimal degrees.
| Region | Westernmost Longitude | Easternmost Longitude | Northernmost Latitude | Southernmost Latitude |
|---|---|---|---|---|
| Contiguous US and Alaska | -165.2138 | -65.30824 | 73.7533 | 22.9363 |
Data File Information
There are 275 files in these dataset including two files in comma-separated values (CSV) format and 273 GeoTIFFs. Each GeoTIFF contains fossil fuel CO2 annual emissions for a given economic sector for each year for the period 2010-2022 for Alaska and for the USA (13 yrs x 11 sectors for the US and 13 years x 10 sectors for Alaska; there are no data for Alaska for the cement industry).
Since the dataset is an aggregation of “native” Vulcan resolution emissions (points, polylines, polygons), the gridded data product contains annual FFCO2 emission sums of all the points, lines and polygons that lie within each 1 km x 1 km cell.
The GeoTIFF file naming convention is: v4.<sector>.co2.<domain>.<resolution>.<projection>.<hilo>.<year>.tif, where
- <sector> refers to one of the following sector designations:
- tot – total emissions
- air – aircraft emissions
- cmt – cement emissions
- cmv – commercial marine vessel emissions
- com – commercial emissions
- elc – electricity production emissions
- ind – industrial emissions
- nrd – nonroad emissions
- onr – onroad emissions
- res – residential emissions
- rrd – railroad emissions
- <domain> refers to either “usa” (contiguous United States) or “ak” (Alaska).
- <resolution> refers to the grid spacing (e.g., “1km” for 1 km x 1 km resolution).
- <projection> refers to the geographical projection. Currently “lcc” for lambert conformal conic.
- <hilo> refers to the sensitivity case (“mn” for mean estimate, “hi” for high sensitivity case, “lo” for low sensitivity case).
- <year> refers to the calendar year in the range 2010 to 2022.
Example file name: v4.nrd.co2.ak.1km.lcc.mn.2013.tif
Properties of the GeoTIFFs
- Coordinate system: Lambert Conformal Conic (LCC) projection; false easting: 0.0 m, false northing: 0.0 m;
longitude of origin: -97.0°, latitude of origin: 40.0°, standard parallel 1: 33.0°, standard parallel 2: 45.0°;
Proj4: "+proj=lcc +lat_0=40 +lon_0=-97 +lat_1=33 +lat_2=45 +x_0=0 +y_0=0 +datum=WGS84 +units=m +no_defs" - Spatial resolution: 1 km x 1 km
- Number of bands: one
- Pixel values: metric ton of carbon per km2 per year (tC km-2 y-1).
- Missing data value: -9999
The CSV files hold aggregations of Vulcan version 4.0 FFCO2 emissions. All data type (point and non point), fuel type (NG, petroleum, coal), and sector combinations are present as individual columns in addition to aggregation to sector totals.
- v4_co2_county_all_years.csv - an aggregation of the Vulcan version 4.0 FFCO2 emissions into all 3141 counties plus the District of Columbia.
- v4_co2_state_all_years.csv - an aggregation of the Vulcan version 4.0 FFCO2 emissions into all 50 states plus the District of Columbia.
Table 1. Variable names for CSV files. The emissions variables named as <sector>_<data-type>_<fuel-type> using the listed abbreviations. For example, "RES_npt_Coal" indicates nonpoint emissions from residential sector from coal as fuel. Units for emissions are metric ton of carbon per km2 per year (tC km-2 y-1).
| Variable or abbreviation | Description |
|---|---|
| State | U.S. state name |
| County | county name |
| FIPS | state/county Federal Information Processing Standards code |
| Year | year of aggregation |
| Sector abbrevations | |
| AIR | Airport |
| CMT | Cement |
| CMV | Commercial Marine Vessels |
| COM | Commercial |
| ELC | Electricity production |
| IND | Industrial |
| NRD | Nonroad |
| ORD | Onroad |
| RES | Residential |
| RRD | Railroad |
| Data type abbreviations | |
| npt | nonpoint (buildings) |
| pt | point |
| Fuel type abbreviations | |
| NG | natural gas |
| petroleum | petroleum products |
| coal | coal |
Application and Derivation
The Vulcan v4.0 FFCO2 emissions data product can be applied to both scientific and policy-related objectives. It can supply a high-resolution boundary condition (“prior”) to atmospheric CO2 inverse efforts to better isolate biospheric net exchange or as a direct constraint to assessing anthropogenic fluxes. Better understanding both the FFCO2 emissions and the net biosphere carbon exchange improves projections of climate change through more reliable estimation of climate-carbon feedback. It can also be used in direct policymaking by offering more granular detail on FFCO2 emission processes and magnitudes. This can provide stakeholders with more optimal policy choices, isolating the timing and location of the largest-emit entities for more specific and targeted mitigation.
Quality Assessment
Quality assurance was similar to Vulcan v3.0 wherein two separate techniques were used to test the general quality of FFCO2 emissions estimates. The first is a comparison to other similar space/time-resolved FFCO2 emission data products. The second approach compared the results to atmospheric CO2 inverse estimates.
Refer to Gurney et al. (2025) for details regarding uncertainty.
Data Acquisition, Materials, and Methods
The information below is from Gurney et al. (2025).
Much of the methodological details of Vulcan version 4.0 are consistent with the methods for Vulcan version 3.0. For the greatest amount of detail on the methods followed by Vulcan version 3.0, the reader is referred to Gurney et al. (2019) and Gurney et al. (2020).
Study area
The study domain is the United States, the fourth-largest country in the world (covering approximately 9.8 million km2) with a population of over 333 million people as of 2022. The FFCO2 emission estimates presented are Scope 1 (i.e., territorial) only and cover 49 states (Hawaii is available in non-gridded form upon request) and the District of Columbia but do not include the U.S. territories (e.g., Puerto Rico).
The native spatial resolution of the Vulcan FFCO2 emissions data product is a combination of points, lines, and polygons dictated primarily by the underlying data sources. The FFCO2 emissions are placed into a regularized continuous gridded 1-km x 1-km landscape for ease of analysis and incorporation into atmospheric transport modeling efforts. The study period covers the years 2010 to 2022.
Sectors
The sector definitions generally follow commonly used application in greenhouse gas (GHG) emissions quantification but a few warrant additional clarity. For example, the electricity production sector includes facilities that produce electricity and are connected to an electrical grid system. Furthermore, like all the sources included in Vulcan v4.0, they only reflect the combustion of fossil fuels. Power production based on non-CO2 emitters such as renewable sources are not included.
The nonroad sector includes all mobile fossil fuel combustion devices that are not considered legal for use on roadways. These include traditional off-road vehicles plus devices such as lawnmowers in addition to waterborne vehicles aside from commercial marine vessels, which are separately managed in the commercial marine vessels sector.
Airport emissions include all aircraft emissions during the taxi, takeoff, and landing cycles up to 3000 feet. Baggage carriers and other mobile airport equipment are included in the nonroad sector. Airport buildings are included in the commercial sector.
Cement production includes both the FFCO2 emissions resulting from the combustion of fossil fuels and the stoichiometric release of CO2 during the calcining process. The latter is the only non-fossil source in Vulcan and is included because of the common norm of doing so and the magnitude of this process which, among the “process” emissions in the U.S., is the largest.
Some sectors reflect input data of both point and nonpoint data types while others reflect input data of only one data type. For example, the industrial sector contains input data of both point and nonpoint while the residential sector only contains nonpoint source reporting data.
Electricity production
Vulcan electricity production FFCO2 emissions represent 13,814 grid-connected power generation facilities in 2022. These have been published as a pointwise data product: Vulcan-power version v1.0 (Gurney et al., 2024). In short, these emissions are built from three data sources: the Environmental Protection Agency’s Clean Air Markets Program Data (CAMPD) (Carbon Pollution Emission Guidelines for Existing Stationary Sources 2015; the Department of Energy’s Energy Information Administration (EIA) EIA-923 survey data, and the United States Environmental Protection Agency’s 2014 and 2017 National Emissions Inventories (NEI) (US EPA 2017, 2021, 2015a and 2015b). Though the CAMPD data set does not include all power plants in the United States, it accounts for 91.6% of the U.S. electricity production FFCO2 emissions in 2022. It reports CO2 emissions based on direct monitoring in the effluent stack. The EIA-923 reporting includes the heat input value (e.g., British thermal units) for each U.S. electricity production facility exceeding a nameplate capacity of 1 MW. FFCO2 emission factors are then utilized to calculate the quantity of FFCO2 emitted from these EIA-923 facilities (Gurney et al., 2016). After the removal of the overlap with the CAMPD facilities (keeping the CAMPD facilities), these EIA facilities account for 7.7% of the FFCO2 emissions in the electricity production sector beyond that reported by CAMPD. The NEI reports carbon monoxide (CO) emissions from smaller electricity production facilities and these are processed to FFCO2 emissions using CO and CO2 emission factors gathered from extensive literature review. Further details on processing of the NEI-based facilities (for other sectors) are discussed in Gurney et al. (2025).
Further development is made in Vulcan version 4.0 by incorporating facility emissions reported to the electricity production sector in the EIA data for which the sole source consumer is either a commercial or industrial entity. These are identified as such in the EIA electricity production reporting and categorized as either commercial or industrial emission sources as appropriate and include as such.
Table 1. Data sources used to derive the Vulcan v4.0 FFCO2 emissions data product. A bibliography for the sources is provided in Table 2.
|
Sector/type |
Emissions Data Source |
Original spatial resolution/information |
Final Spatial Distribution |
Final Temporal Distribution |
|
Electricity production |
CAMPDf CO2 (to 2022), DOE/EIAg fuel (to 2022), EPA 2014 and 2017 NEI point CO |
Spatial resolution: Lat/lon. Temporal resolution: CAMPD: hourly, EIA: monthly, NEI: annual. Additional attributes: fuel type, energy supply technology |
Provided Lat/Lon with expanded manual corrections via Google Earth |
CAMPD: hourly, EIA: monthly, NEI: annual. All processed to hourly. |
|
Onroad |
EMFACa CO2, EPA 2014 and 2017 NEIb onroad CO2 |
Spatial resolution: county Temporal resolution: annual Categories: road class, vehicle class |
FHWA AADTc gap-filled and downscaled to road segments, Basemap: HPMS/OSM |
SEDSn multiyear (MY) scaling and time-series smoother. CCSe gap-filled and downscaled from annual to hourly |
|
Residential nonpoint buildings |
EPA 2014 and 2017 NEI nonpoint CO |
Spatial resolution: County Temporal resolution: annual Categories: fuel type |
ACS fuel share to block-group, FEMA HAZUSd, DOE RECS NE-EUIh to US Census block |
SEDS MY scaling and time-series smoother. eQUESTi model to hourly (with TMY3: 1991-2005 mean) |
|
Nonroad |
NEI 2014 and 2017 nonpoint CO |
Spatial resolution: County Temporal resolution: annual Categories: vehicle class |
EPA spatial surrogates (vehicle class specific) |
EPA temporal surrogates (by SCCj) to hourly |
|
Airport |
EPA 2014 and 2017 NEI point CO |
Spatial resolution: Lat/lon Temporal resolution: Hourly/daily Categories: aircraft class |
Lat/Lon |
SEDS MY scaling and time-series smoother. FAA OPSNETk to hourly |
|
Commercial nonpoint buildings |
EPA 2014 and 2017 NEI nonpoint CO |
Spatial resolution: County Temporal resolution: annual Categories: fuel type |
FEMA HAZUS, DOE CBECS NE-EUIl |
SEDS MY scaling and time-series smoother. eQUEST model to hourly (with TMY3: 1991-2005 mean) |
|
Commercial point sources |
EPA 2014 and 2017 NEI point CO, SMOKE “flatfiles” |
Spatial resolution: Lat/lon Temporal resolution: Categories: fuel type, combustion technology |
EPA NEI Lat/Lon, Google Earth |
SEDS MY scaling and time-series smoother. eQUEST model to hourly |
|
Industrial point sources |
EPA 2014 and 2017 NEI point CO |
Spatial resolution: Lat/Lon Temporal resolution: annual Categories: fuel type, combustion technology |
EPA NEI Lat/Lon, Google Earth |
SEDS MY scaling and time-series smoother. EPA temporal surrogates (by SCC) to hourly |
|
Industrial nonpoint buildings |
EPA 2014 and 2017 NEI nonpoint CO |
Spatial resolution: County Temporal resolution: annual Categories: fuel type |
FEMA HAZUS, DOE MECS NE-EUIm |
SEDS MY scaling and time-series smoother. eQUEST model to hourly, (with TMY3: 1991-2005 mean) |
|
Commercial Marine Vessels |
EPA 2014 and 2017 NEI nonpoint CO |
Spatial resolution: County Temporal resolution: annual Categories: fuel type, port/underway |
EPA port and shipping lane shapefiles |
Flat time structure to hourly |
|
Railroad |
EPA 2014 and 2017 NEI nonpoint CO, EPA 2014 and 2017 NEI point CO |
Spatial resolution: County, Temporal resolution: annual Categories: fuel type, segment |
EPA NEI rail shapefile and density distribution |
Point records: EPA temporal surrogates (by SCC) to hourly. Nonpoint: flat time structure to hourly |
|
Cement |
Portland Cement Association, USGS |
Spatial resolution: Lat/lon Temporal resolution: annual |
PCA lat/lon checked in Google Earth |
Flat time structure to hourly |
Footnotes:
- a. Emissions Factors Model
- b. Environmental Protection Agency, National Emissions Inventory
- c. Federal Highway Administration, Annual Average Daily Traffic
- d. Federal Emergency Management Agency
- e. Continuous Count Stations
- f. Clean Air Markets Division
- g. Department of Energy/Energy Information Administration
- h. Department of Energy Residential Energy Consumption Survey, non-electric energy use intensity
- i. Quick Energy Simulation Tool
- j. Source Classification Code
- k. Los Angeles World Airport, The Operations Network
- l. Department of Energy Commercial Energy Consumption Survey, non-electric energy use intensity
- m. Department of Energy Manufacturing Energy Consumption Survey, non-electric energy use intensity
Emission Sources
Point Sources
The point emissions represent facilities reported in the 2014 and 2017 NEI with a physically identifiable emission stack or point location and exceed a specific criteria air pollution threshold (US EPA, 2021). Vulcan version 4.0 follows the same approach as that taken in Vulcan version 3.0. However, the core input data from the NEI now utilizes the 2014 and 2017 NEI releases as opposed to the 2011 NEI release used in Vulcan version 3.0. The point processing includes sources classified as industrial, commercial, airport, railroad, and nonroad emitters. Airport, railroad, and nonroad are discussed separately below as they require additional processing beyond that described in this section. Hence, the point processing in the industrial and commercial sectors are described below.
Vulcan reports FFCO2 emissions for 50,720 and 51,284 individual facilities in 2014 and 2017, respectively. A number of key fields define a point location for the purposes of the Vulcan point FFCO2 emissions estimation and include the state and county FIPS code, the“state facility identifier” (which identifies the individual emitting facility), and the tribal code (used in place of the FIPS in tribal lands). Each site or facility can have multiple emission points (different“stacks”), emission units (different buildings or portions of a complex facility or site), or emission processes (e.g., energy production, heaters, engines). Some of these have different geocoded locations and these are retained in the Vulcan processing.
Each point emission record from the 2014 and 2017 NEI contains a source classification code (SCC), a numerical sequence that identifies characteristics of the emitting entity including sector, fuel, and combustion technology (US EPA, 1995). Most importantly, each record reports the amount of CO emissions. Both (SCC and CO amounts) are essential to the retrieval of appropriate CO and CO2 emission factors (EFs) used to transform the CO emissions into CO2 emissions.
The use of two different NEI reporting cycles required temporal harmonization. The complete 2010-2022 time series was constructed by state/sector/ fuel type scaling supplied by the EIA SEDS data (US EIA, 2024). This multiyear scaling is to either the anchor data year of 2014 (for years 2010-2013, 2015) or the anchor data year 2017 (years 2016, 2018–2022). However, inspection of the complete time series made clear that the two NEI reporting cycles were likely not internally consistent and showed suspicious emission changes between 2014 and 2017 at many individual point facilities in the complete point multiyear results. It is not possible to trace the source of these unlikely changes in emissions between the NEI reporting cycles. A time series smoothing approach was employed to reduce this temporal inconsistency. An adjustment factor is created for the 2010 to 2015 time period and the 2016 to 2022 (or current end year) time period at the facility scale. This is done by differencing the 2014 and 2017 values for each facility record common between the two years and comparing that to the mean of the first and second time period standardized variances (the “background” variance).
Further development is made in Vulcan version 4.0 by incorporating facility emissions reported to the electricity production sector in the EIA data noted in the previous section but for which the sole source consumer is either a commercial or industrial entity. These are identified as such in the EIA electricity production reporting and categorized as either commercial or industrial emission sources as appropriate and include as such.
Additional updates have been made to the CO and CO2 emission factors used in processing the point source CO emissions from the NEI reporting.
Nonpoint Sources
Nonpoint emissions as reported in the 2014 and 2017 NEI encompass diffuse sources of emissions that are not reported via the point reporting or via reporting for onroad emissions (US EPA 2015a, 2017). Nonpoint emissions contribute to, or fully constitute, emissions in the residential, commercial, industrial, nonroad, railroad, and commercial marine vessels (CMV) sectors used in Vulcan. As with the point source emissions methodology, the procedures are consistent with those described in the Vulcan version 3.0 data product with some exceptions. As with point emissions, the core input data from the NEI now utilizes the 2014 and 2017 NEI releases (Vulcan version 3.0 used 2011 NEI releases).
The use of two different NEI reporting cycles for nonpoint emissions also required temporal harmonization. The complete 2010-2022 time series was constructed by state/sector/ fuel type scaling supplied by the EIA SEDS data (US EIA, 2024). This multiyear scaling is to either the data year of 2014 (for years 2010-2013, 2015) or the data year 2017 (years 2016, 2018-2022). Similar jumps noted in the point data were evident in the nonpoint reporting albeit for spatial units of counties as opposed to facilities. A time series smoothing approach was employed to reduce this temporal inconsistency. An adjustment factor was created for the 2010 to 2015 time period and the 2016 to 2022 (or current end year) time period at the sector/county/fuel type scale. This was done by differencing the 2014 and 2017 values for each sector/county/fuel type record common between the two years and comparing that to the mean of the first and second time period standardized variances (the “background” variance).
The Vulcan version 4.0 increases the resolution of the subcounty distribution for the nonpoint residential, commercial, and industrial FFCO2 emissions from that of U.S. Census block-groups to U.S. Census blocks. U.S. Census blocks are defined as the smallest geographic unit for which the U.S. Census Bureau collects and tabulates demographic data. They vary in size depending upon the population density but in a typical city they are similar to a city block bounded by roadways on all sides. A U.S. Census block-group is a larger unit, often composed of a cluster of blocks, again varying in size across the U.S. landscape.
The sub-county FFCO2 emissions distribution procedure follows the approach taken in Vulcan version 3.0 with some differences in input data. The downscaling uses the product of total building floor area (specific to a building class) within each U.S. Census block and an estimate of energy use intensity (EUI) specific to fuel type/ census division/climate zone/building type.
As in Vulcan version 3.0, the fuel-specific EUI values are calculated from the EIA residential, commercial, and industrial building energy consumption surveys. In Vulcan version 4.0, updates to the survey input data are made. The input data for the total floor area (TFA) at the scale of a U.S. Census block remains sourced from the HAZUS General Building Stock data (FEMA, 2024). The floor area data are obtained from FEMA HAZUS v5.1 and HAZUS v6.0 data (v5.1 is based on the 2010 U.S. Census; v6.0 is based on the 2020 U.S. Census) at the U.S. census block resolution. Years 2010-2019 use the 2010 census block boundary definitions while years 2020-2022 use the 2020 census block boundary definitions (the floor area data was available only for the two Census years). The floor area for all the intermediate years (2011–2019) were linearly interpolated at the block scale. The 2020 TFA was used for the years 2021 and 2022.
Onroad
Vulcan version 4.0 onroad FFCO2 emissions start with information from the 2014 and 2017 National Emissions Inventory (NEI) instead of the Vulcan version 3.0 2011 NEI. The NEI estimates, in turn, are derived from updated simulations using the Motor Vehicle Emissions Simulator model (https://www.epa.gov/moves/latest-version-motor-vehicle-emission-simulator-moves) versions MOVES2014a and MOVES2014b for 2014 and 2017 respectively across all counties except the state of California. The NEI quantifies onroad emissions by U.S. county, distinguishing 13 distinct vehicle types (which include various vehicle classes and fuel types) and five road types (including parking), as well as differentiating between urban and rural roads. These simulations rely on a County Database (CDB) compiled from submissions by State, Local, and Tribal (SLT) agencies. The CDB contains important inputs to the model emissions estimation, such as vehicular registrations, fleet characteristics, age, average speed, and fuel properties.
The NEI categorizes CO2 emissions according to two road classes: restricted (with guard rails) and unrestricted. The Highway Performance Monitoring System (HPMS), which provides Vulcan with traffic volume data and contributes to the road network basemap, identifies seven road classes (Interstates, Other Freeways & Expressways, Principal Arterials, Minor Arterials, Major Collectors, Minor Collectors and Local Roads).
FFCO2 emissions at the county scale were downscaled to road segments prior to aggregation to the 1-km × 1-km gridcells. The road basemap used in Vulcan version 4.0 is an update to the basemap used in Vulcan version 3.0. Vulcan version 4.0 generates a road basemap by integrating the HPMS and Open Street Map OSM; http://download.geofabrik.de/)road networks (Haklay and Weber, 2008).
Airport
The airport FFCO2 emissions are only associated with the taxi and takeoff/landing sequences and are derived from the 2014/2017 NEI point input data. FFCO2 emissions associated with non-aircraft processes such as building operations and non-aircraft mobile sources are reported as emissions in other sectors (e.g. commercial, nonroad). Multi-year scaling using the EIA SEDS data was used to create the complete time series from 2010–2022. Other than the updated input data, no further changes were deployed in comparison to Vulcan version 3.0.
Railroad
FFCO2 emissions associated with U.S. railroad activity is characterized from the processing of both the 2014/2017 NEI point and nonpoint source data. It is critical to note that the 2014 nonpoint rail FFCO2 emissions have common IDs allowing for the emissions to be linked to a US railroad basemap file containing all US rail links. However, the 2017 NEI railroad nonpoint records have no similar IDs. Hence, the spatial pattern deter-mined for the 2010–2015 time period (based on NEI 2014 and its linkage to the railway shapefile) was carried forward from 2016 to 2022 based on the relative nonpoint county railroad FFCO2 totals.
The point railroad content (depots, rail yards) shows 961 records in the 2010–2015 time period (reflecting the 2014 NEI input data) and 457 records in the 2016–2020 time period (reflecting the 2017 NEI input data). No further changes were deployed in comparison to Vulcan version 3.0.
Nonroad
The nonroad nonpoint FFCO2 was constructed at the county spatial scale only in Vulcan version 4.0. This is distinct from the treatment in Vulcan version 3.0 which included spatial and temporal proxies at the sub-county and sub-annual scales. This change was dictated by the limited gain in accuracy to the labor involved in further downscaling the nonpoint and point output for this sector only. The Vulcan version 4.0 nonroad nonpoint emissions rely on the output of Vulcan version 3.0, further scaling the 2010–2015 emissions to the longer time series up to 2022. The emissions have separate entries for natural gas and petroleum emissions.
Point emissions are ingested from the point processing for this sector and are hence, at the facility-scale. To generate a complete 2010–2022 time series based on the Vulcan version 3.0 output, the SEDS dataset for state-scale natural gas and petroleum nonroad consumption is rescaled as relative to 2014 only. This is done by availing of the ratio of the total US nonroad NEI 2017 to NEI 2014 FFCO2 emissions. This national ratio is combined with the nonroad/state/fuel SEDS ratios in the 2016–2022 time period to establish ratios in the entire timespan that are relative to 2014 only. These are then applied to arrive at a complete 2010–2022 time series of county nonroad FFCO2 emissions for natural gas and petroleum separately.
Commercial Marine Vessels (CMV)
Commercial marine vessel (CMV) emissions include vessels directly or indirectly involved in commerce or military activity. The emissions encompass maneuvering, hoteling, cruise and reduced speed zone travel and are specific to geographically located ports and shipping lanes that extend 12 nautical miles from the U.S. shoreline. FFCO2 emissions associated with U.S. commercial marine vessel (CMV) activity is characterized from the processing of the 2014/2017 NEI nonpoint source data. It is critical to note that the 2014 nonpoint CMV FFCO2 emissions have common IDs allowing for the emissions to be linked to a U.S. CMV geographic basemap reflecting both port and shipping lane spatial information. However, the 2017 NEI CMV nonpoint records have IDs that have no partner in the geographic spatialization files. Hence, the spatial pattern determined for the 2010-2015 time period (based on NEI2014 and its linkage to the CMV shapefile) was carried forward from 2016 to 2022 based on the relative nonpoint county CMV FFCO2 totals.
Cement Production
CO2 is emitted from cement manufacturing. The process-derived CO2 emissions result from the chemical process that converts limestone to calcium oxide and CO2. This occurs during clinker production (clinker is the raw material for cement which is produced by grinding the clinker material). Unlike the Vulcan version 3.0 approach in which only the stoichiometric emissions were calculated and it was assumed that the emissions due to fuel combustion were captured in the NEI point source reporting, Vulcan version 4.0 calculates the fuel combustion component directly from clinker production and removes any records from the NEI point source reporting related to the fuel combustion component of cement production.
The stochiometric CO2 emissions remain identical to the methodological approach taken in Vulcan version 3.0. The calculation of FFCO2 due to fuel consumption in cement facilities is based on the generation of an emission factor based on the production of clinker at each cement producing facility (tC/kt clinker). This emission factor is a US mean value and derived from data provided by the United States Geological Survey National Minerals Information Center Minerals Yearbook (https://www.usgs.gov/centers/national-minerals-information-center/ cement-statistics-and-information). This provides the total U.S. clinker production and the fuel consumed, by fuel type, to generate the clinker.
Table 2. Bibliography of data sources
|
California Air Resources Board (2014) EMFAC2014 Volume I – User’s Guide, v1.0.7, April 30, 2014, California Environmental Protection Agency Air Resources Board, Mobile Source Analysis Branch, Air Quality Planning & Science Division. Commercial Building Energy Consumption Survey (2016) 2012 CBECS microdata files and information, U.S. Energy Information Administration. Retrieved from: https://www.eia.gov/consumption/commercial/data/2012/index.php?view=microdata (Aug 1, 2018). Department of Energy/Energy Information Administration (2003) Electric Power Monthly March 2003, Energy Information Administration, Office of Coal, Nuclear, and Alternate Fuels, U.S. Department of Energy, Washington D.C. 20585, DOE/EIA-0226 (2003/03). Department of Energy/Energy Information Administration (2018) State Energy Consumption Estimates 1960 through 2016, DOE/EIA-0214(2016), June 2018, Washington DC. Eastern Research Group: Documentation for Locomotive Component of the National Emissions Inventory Methodology, prepared by: Eastern Research Group, ERG No.: 0245.02.401.001, Contract No.: EP-D-07-097, 2011. Eastern Research Group: Development of 2011 Railroad Component for National Emissions Inventory, Memorandum from Heather Perez, Susan McClutchey, and Richard Billings/ERG, to Laurel Driver/US EPA, September 5, 2012. Federal Emergency Management Agency (2017) HAZUS database. Retrieved from: https://www.fema.gov/summary-databases-hazus-multi-hazard (Aug 1, 2018). Gurney, K.R., Huang, J., and Coltin, K. (2016) Bias present in US federal agency power plant CO2 emissions data and implications for the US clean power plan. Env. Res. Lett., 11:064005. https://doi.org/10.1088/1748-9326/11/6/064005 Gurney, K.R., Mendoza, D., Zhou, Y., Fischer, M., de la Rue du Can, S., Geethakumar, S., Miller, C. (2009) The Vulcan Project: High resolution fossil fuel combustion CO2 emissions fluxes for the United States, Environ. Sci. Technol., 43(14):5535-5541. https://doi.org/10.1021/es900806c Hastings, Norene: personal communication (2014) Environmental Supervisor, LAWA, Environmental Services division, January 2014. Highway Performance Monitoring System (2017). Hirsch, J. & Associates (2004) Energy Simulation Training for Design & Construction Professionals. Retrieved from: http://doe2.com/download/equest/eQuestTrainingWorkbook.pdf (Aug 1, 2018). eQuest model download available from: http://www.doe2.com/eQuest/ (Aug 1, 2018). Jessberger, Steven: personal communication (2016) Engineer, Federal Highway Administration, Office of Highway Policy Information, Travel Monitoring and Surveys, 1200 New Jersey Avenue, S.E., HPPI-30, E83-418, Washington, DC 20590, USA, 202-366-5052, 202-366-7742). Manufacturing Energy Consumption Survey (2010) 2010 MECS Survey Data, U.S. Energy Information Administration. Retrieved from: https://www.eia.gov/consumption/manufacturing/data/2010/#r10 (Aug 1, 2018). Portland Cement Company, Economic Research Department: U.S. and Canadian Portland Cement Industry Plant Information Summary, Portland Cement Association, Skokie, IL, 2006. Residential Energy Consumption Survey (2013) 2009 RECS Survey Data, U.S. Energy Information Administration. Retrieved from: https://www.eia.gov/consumption/residential/data/2009/index.php?view=microdata (Aug 1, 2018). United States Environmental Protection Agency (2005c), EPA’s National Mobile Inventory Model (NMIM), A consolidated emissions modeling system for MOBILE6 and NONROAD, Office of Transportation and Air Quality, Assessment and Standards Division, U.S. Environmental Protection Agency, EPA420-R-05-024, December. United States Environmental Protection Agency (2005d), User’s Guide for the Final NONROAD2005 Model, Assessment and Standards, Division Office of Transportation and Air Quality U.S. Environmental Protection Agency, December. United States Environmental Protection Agency (2011) 2011 National Emissions Inventory, version 1 Technical Support Document, June 2014 – Draft. Office of Air Quality Planning and Standards. Retrieved from: https://www.epa.gov/air-emissions-inventories/2011-national-emissions-inventory-nei-technical-support-document (August 12, 2018). U.S. Environmental Protection Agency (2012) Motor Vehicle Emission Simulator (MOVES): User Guide for MOVES2010b Office of Transportation and Air Quality, EPA-420-B-12-001b. Retrieved from: https://nepis.epa.gov/Exe/ZyPDF.cgi?Dockey=P100EP28.pdf (August 12, 2018). United States Environmental Protection Agency. 2014 National Emissions Inventory (NEI) Data https://www.epa.gov/air-emissions-inventories/2014-national-emissions-inventory-nei-data United States Environmental Protection Agency. 2017 National Emissions Inventory (NEI) Data. https://www.epa.gov/air-emissions-inventories/2017-national-emissions-inventory-nei-data United States Environmental Protection Agency, 40 DFR Part 60, EPA-HQ-OAR-2013-0602; FRL-XXXX-XX-OAR, RIN 2060-AR33, Carbon Pollution Emission Guidelines for Existing Stationary Sources: Electric Utility Generating Units, August 3, 2015. United States Environmental Protection Agency (2015c) Technical Support Document (TSD) Preparation of Emissions Inventories for the Version 6.2, 2011 Emissions Modeling Platform, U.S. Environmental Protection Agency, Office of Air Quality Planning and Standards, Air Quality Assessment Division, contacts: Alison Eyth, Jeff Vukovich, August 2015. Retrieved from: https://www.epa.gov/air-emissions-modeling/2011-version-62-technical-support-document (July 27, 2018). United States Environmental Protection Agency WebFIRE Database. https://cfpub.epa.gov/webfire/ United States Geological Survey (2013) 2011 Minerals Yearbook: Cement, U.S. Department of the Interior, U.S. Geological Survey. December 2013. United States Environmental Protection Agency. 2014 National Emissions Inventory (NEI) Data https://www.epa.gov/air-emissions-inventories/2014-national-emissions-inventory-nei-data US EPA. 2011 National Emissions Inventory (NEI) Data. https://www.epa.gov/air-emissions-inventories/2011-national-emissionsinventory-nei-data |
Data Access
These data are available through the Oak Ridge National Laboratory (ORNL) Distributed Active Archive Center (DAAC).
Vulcan: High-Resolution Annual Fossil Fuel CO2 Emissions in USA, 2010-2022
Contact for Data Center Access Information:
- E-mail: uso@daac.ornl.gov
- Telephone: +1 (865) 241-3952
References
Haklay, M. and P. Weber. 2008. OpenStreetMap: User-Generated Street Maps. IEEE Pervasive Computing 7:12-18. https://doi.org/10.1109/MPRV.2008.80
Hirsch, J. and Associates. 2004. Energy Simulation Training for Design & Construction Professionals. Retrieved from: http://doe2.com/download/equest/eQuestTrainingWorkbook.pdf (Aug 1, 2018). eQuest model download available from: http://www.doe2.com/eQuest/ (Aug 1, 2018).
Gurney, K.R., P. Dass, A. Kato, B. Mitra, and M.K.Nematchoua. 2024. Scope 2 estimates of carbon dioxide emissions from electricity consumption at the US census block group scale. Scientific Data 11:1344. https://doi.org/10.1038/s41597-024-04180-5
Gurney, K.R., P. Dass, A. Kato, L. Gawuc, B. Aslam, and S. Huilin. 2025. Vulcan version 4.0 high-resolution annual carbon dioxide emissions in the U.S. for the 2010-2022 time period. Scientific Data 12:1946. https://doi.org/10.1038/s41597-025-06391-w
Gurney, K.R., J. Liang, R. Patarasuk, Y. Song, J. Huang, and G. Roest. 2020. The Vulcan Version 3.0 High Resolution Fossil Fuel CO2 Emissions for the United States. Journal of Geophysical Research: Atmospheres 125:e2020JD032974. https://doi.org/10.1029/2020JD032974
Gurney, K.R., J. Liang, R. Patarasuk, Y. Song, J. Huang, and G. Roest. 2019. Vulcan: High-Resolution Annual Fossil Fuel CO2 Emissions in USA, 2010-2015, Version 3. ORNL DAAC, Oak Ridge, Tennessee, USA. https://doi.org/10.3334/ORNLDAAC/1741
Gurney, K.R., J. Huang, and K. Coltin. 2016. Bias present in US federal agency power plant CO2 emissions data and implications for the US clean power plan. Environmental Research Letters 11:064005. https://doi.org/10.1088/1748-9326/11/6/064005
United States Department of Energy’s Energy Information Administration (EIA) EIA-923 survey data. https://www.eia.gov/electricity/data/eia923/index.php
United States Environmental Protection Agency. 2017 National Emissions Inventory: January 2021 Updated Release, Technical Support Document EPA-454/R-21-001.
United States Environmental Protection Agency. 2017 National Emissions Inventory (NEI) Data.
United States Environmental Protection Agency’s Clean Air Markets Program Data (CAMPD) (Carbon Pollution Emission Guidelines for Existing Stationary Sources 2015. https://campd.epa.gov/
United States Environmental Protection Agency. 2014 National Emissions Inventory (NEI) Data https://www.epa.gov/air-emissions-inventories/2014-national-emissions-inventory-nei-data (2015a)
United States Environmental Protection Agency. 2011 National Emissions Inventory, version 2 Technical Support Document. (2015b).
United States Environmental Protection Agency. FIRE Version 5.0 Source Classification Codes and Emission Factor Listing for Criteria Air Pollutants. https://www.epa.gov/ sites/default/files/2020-11/documents/454r95012_0.pdf (1995).
United States Federal Emergency Management Agency. HAZUS User Guide HAZUS 7.0. https://www.fema.gov/sites/default/files/documents/fema_hazus_7_user_guide.pdf (2024).
Dataset Revisions
| Version | Release Date | Revision Notes |
|---|---|---|
| 4.0 | 2026-08-04 | This is the second version archived at the ORNL DAAC. This version updates Vulcan version 3 and includes an extension of the time period covered, algorithmic improvements, underlying resolution improvements, and updated data inputs. This version covers the period 2010-2022 |
| 3.0 | 2020-09-30 | This is the first version archived at the ORNL DAAC for version 3 of the Vulcan annual fossil fuel CO2 emissions data. This version covers the period 2010-2015 |